Plant fibers
Fibers from plant materials can be used for sustainable horticulture. Examples are wood chips, wood shavings, woody fractions of peat bogs, woody fraction of compost, miscanthus, bark, flax shives, reed, etcetera. If you are interested in a specific plant material, click on this box to see the specific opportunities.
Plant fibers can be treated by defiberization and by gasification. Click on the specific boxes for more information on techniques, necessary conditions, tests, etcetera.
Woody fraction of green waste is treated as a separate stream and has also several treatment options for sustainable horticulture (see box below).
Woody fraction of green waste
Woody fraction of green waste can be treated for sustainable horticulture, by defiberation and gasification. Click on the specific boxes for more information on techniques, necessary conditions, tests, etcetera.
Spent growing media
Spent growing media can be treated for sustainable horticulture by gasification, composting and steam treatment. Click on the specific boxes for more information on techniques, necessary conditions, tests, etcetera.
Shellfish waste
Seafood waste material can be treated for sustainable horticulture. Examples are shrimp shells, crab shells and Chines mitten crab. If you are interested in a specific shellfish waste, click on this box to see the specific opportunities.
Shellfish waste can be treated by torrefication and chitin extraction. Click on the specific boxes for more information on techniques, necessary conditions, tests, etcetera.
Gases
Gases containing CO2 can be purified for use in sustainable horticulture. All type of flue gases with sufficient amount of CO2 are in general suitable for the technology. Test and full scale industrial units are operational using flue gases from wood fired boilers.
Wood chips
Wood chips, e.g. from the wood industry. Wood chips were tested for defiberization by hammer mill and wood chipper and for gasification (click on the boxes of these techniques for more information).
Wood shavings
Wood shavings, e.g. from the wood industry. Wood shavings were tested for defiberization by hammer mill (click on the boxes of these techniques for more information).
Woody fraction peat bogs
Woody fraction sieved from peat bogs were tested for defiberization by hammer mill and extruder (click on the boxes of these techniques for more information).
Woody fraction compost
Woody fraction of green waste compost was tested for defiberization by hammer mill and extruder (click on the boxes of these techniques for more information).
Woody fraction of green waste
(tekst nog aan te leveren)
Miscanthus
Miscanthus shives were tested for defiberization by hammer mill and extruder, and for gasification (click on the boxes of these techniques for more information).
Bark
Bark from Pinus sylvestris and Pinus maritima was tested for defiberization by hammer mill (click on the boxes of these techniques for more information).
Flax shives
Flax shives were tested for defiberization by hammer mill and for gasification (click on the boxes of these techniques for more information).
Reed
Reed was not specifically tested in the Horti-BlueC project, but it was tested for defiberization and other treatments in the I-Love-T project (Vandecasteele et al., 2018). A special attention point is the moist content that should not be too high.
Vandecasteele, B., Muylle, H., De Windt, I., Van Acker, J., Ameloot, N., Moreaux, K., Coucke, P. and Debode, J. (2018) Plant fibers for renewable growing media: Potential of defibration, acidification or inoculation with biocontrol fungi to reduce the N drawdown and plant pathogens. J. Clean Prod. 203, 1143-1154
Organic growing media
Only spent organic growing media (based on peat, coir, plant fibers, compost, etcetera) can be treated by gasification, composting and steam treatment (click on the boxes of these techniques for more information).
Mineral growing media
Spent mineral growing media (e.g. based on stone wool) can not be treated by gasification, composting and steam treatment.
Shrimp shells
Shrimp shells were tested for chitin extraction and torrefication (click on the boxes of these techniques for more information).
Crab shells
Crab shells were not specifically tested within the Horti-BlueC project, but could similar to the shrimp shells by treated by chitin extraction and torrefication (click on the boxes of these techniques for more information).
Chinese mitten crab
The invasive species Chinese mitten crab was tested for chitin extraction and could potentially also be used for torrefication (click on the boxes of these techniques for more information).
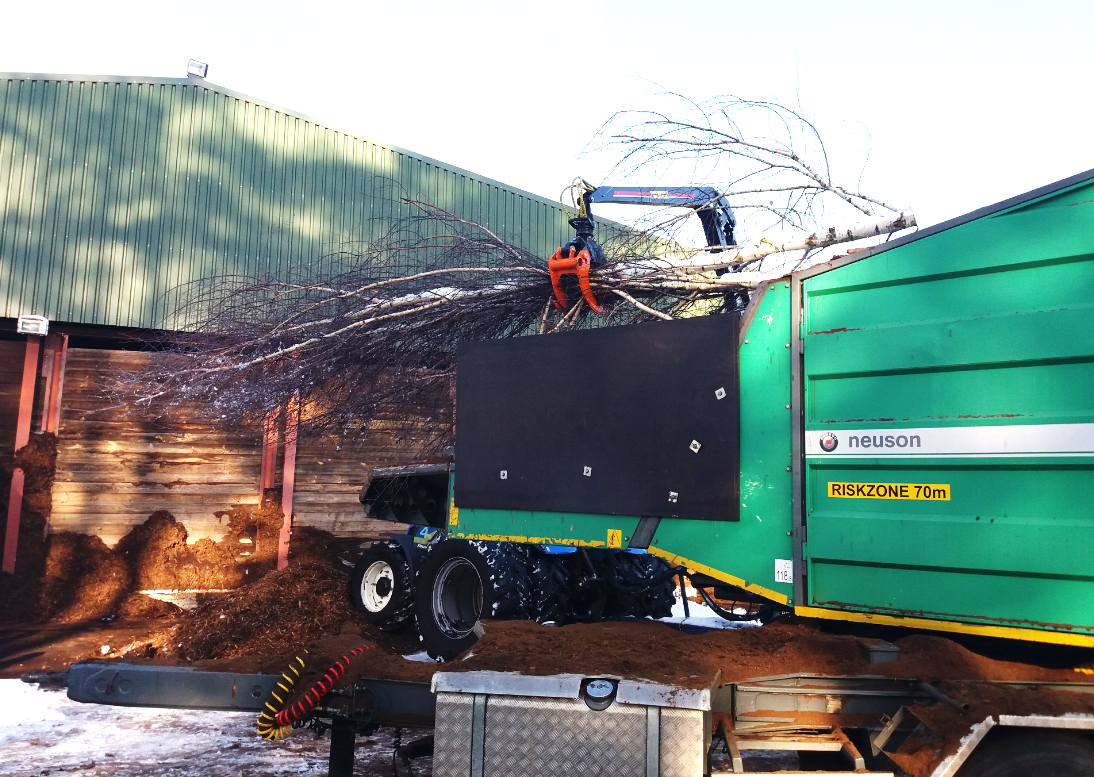
Defiberization
During this technique plant fibers are subjected to high pressure and high temperature treatments, rendering a light and fluffy material, with a high internal surface, ideal for the use in growing media. In addition the defiberization technique renders the plant fibers less susceptible to N immobilization when used in the growing media.
Necessary conditions of the material:
- To run a successful test, a minimum of 5 m³ material is needed.
- No rocks may be present in the materials.
- Storage: The treated materials can be stored up to a year when stored dry, and when the temperatures are checked weekly to avoid composting inside the material. Especially materials with small fraction size (0-10 mm) can start a composting process when stored in heaps. The temperature must be checked weekly to see whether the heap must be opened and cooled to prevent composting.
Gasification
Pyrolysis is the general term that refers to the process of heating biomass to temperatures typically between 300°C and 700°C under oxygen-deprived conditions, leading to biochar as the solid co-product together with combustible gas. The addition of sub stoichiometric oxygen changes the process to gasification, that leads to less biochar and more combustible gas yield, and more important, leads to biochars with higher porosity and very low tar content.
The waste streams need to be placed in an oven for drying prior to their storage, to avoid decay yeast formation before their thermal treatment. There is no maximum period of storage, but storage must be cool and dry.
During the pyrolysis, combustible gas is formed which is intended for heat production in gas boilers or combustors. Special care must be taken to avoid leaking of gas during the process. The standard safety equipment (gas monitoring, gas pipelines, fire security) with which the lab is equipped is sufficient to conform to safety rules.
Concerning the waste stream processing, the standard personal safety equipment (gloves, glasses) is sufficient, as the streams are not dangerous or toxic.
There are no legal aspects that may create obstacles as to the operation of the waste handling and the use of products.
Biochar quantities of approximately 3 kg have been produced for each processing condition and feedstock, and samples have been provided to ILVO for initial analysis of their agronomical and chemical analysis.
Upscale of the process has not been possible at the moment. At industrial scale probably more than one reactor has to operate in parallel to achieve the necessary quantity.
Pyrolysis experiments have been performed by ECN > TNO using the Pyromaat reactor under controlled conditions. The Pyromaat reactor is an indirectly heated screw feeding reactor. It is able to convert typically 3 - 5 kg/h of feestock in an O2-free atmosphere at temperatures up to 800°C. Solid fuel residence times are 15 – 30 and 60 minutes, steam and CO2 was used for activation. The heat needed in the rotary kiln reactor is supplied indirectly over the reactor wall. The pyrolysis gas temperature at the outlet of the rotary kiln can be set between 350°C and 700°C. The reactor is a cylindrical horizontal vessel, which rotates slowly around its axis. As the reactor rotates, material gradually moves down towards the lower end, and may undergo a certain amount of stirring and mixing. This reactor is typical used for low temperature pyrolysis because of the longer residence times and an unproblematic continuous feeding and discharge of the solid components. The reactor allows for an inert gas flow in countercurrent mode to prevent tar condensation.
The pyrolysis experiments include the named waste streams at a fixed furnace temperatures (650°C and 400°C as measured at the outer wall of the reactor). There are numerous temperature measurement points on the outside wall (T1-10) but not on the inside wall of the reactor tube (shown in Fig. 3). Each pyrolysis run lasted at least three hour to ensure sufficient biochar product for characterisation and incubation experiments. This first test series focused on the complete energy and mass balances of the biochar production process in order to identify bottlenecks and thus optimise the process. Rather than delivering separate factsheets per feedstock we chose to deliver one factsheet for this first and complete test round, while fact sheet 2 focuses on the actual production of quantities per feedstock without further focus on the full mass and energy balance.
In a second set of experiments, the pyrolysis conditions remained at 400°C in order to focus on the tradeoff between biochar yield and quality. The pyrolysis experiments include the named waste streams at a fixed furnace temperatures (650 °C as measured at the outer wall of the reactor). There are numerous temperature measurement points on the outside wall (T1-10) but not on the inside wall of the reactor tube (shown in Fig. 2). Each pyrolysis run lasted at least three hour to ensure sufficient biochar product for characterisation and incubation experiments.
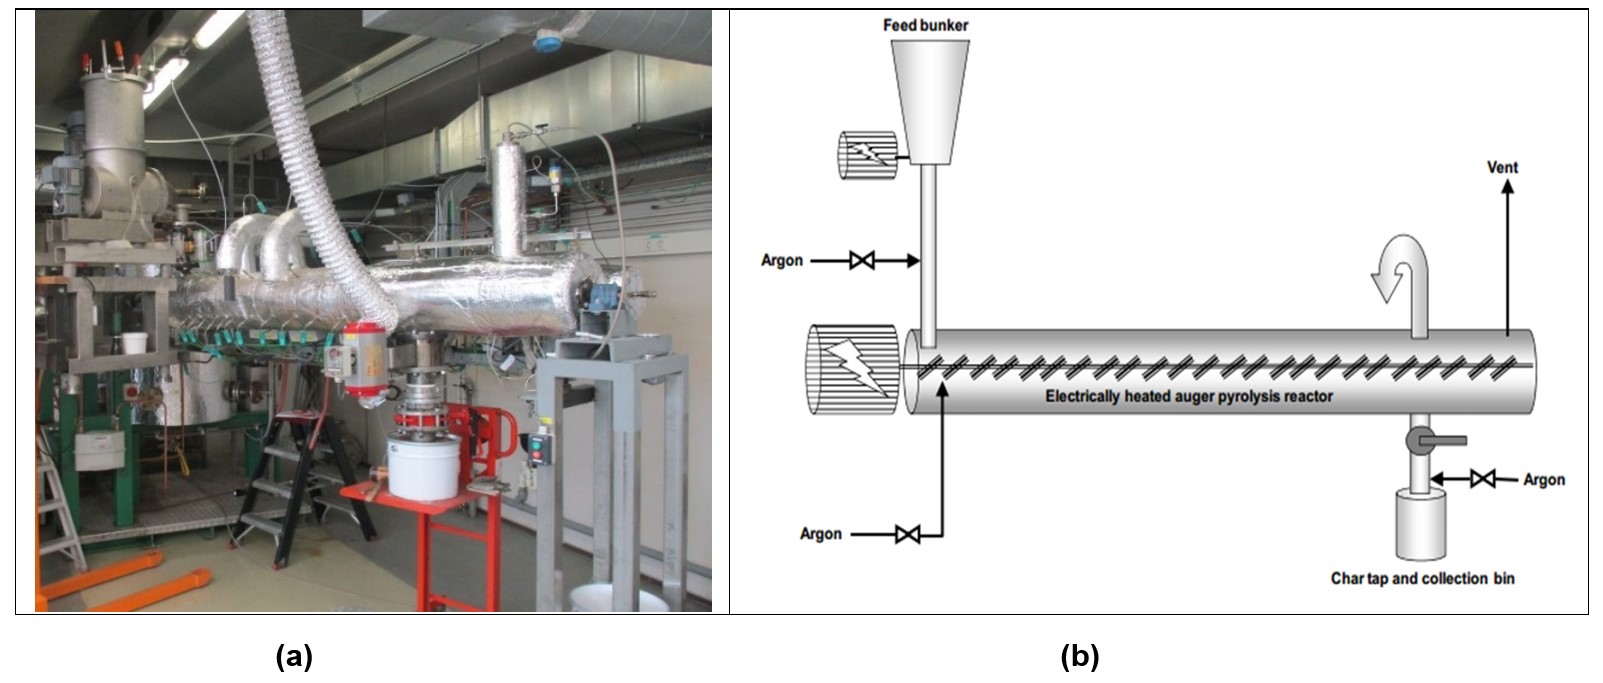
Figure 3. (a) Full view of the Pyromaat and (b) schema of the counter current flow
Results for the first experiments:
- Biochar and combustible gas: Mass yield shown in Figure 1
- Energy and Mass balance: Results in Figure 2
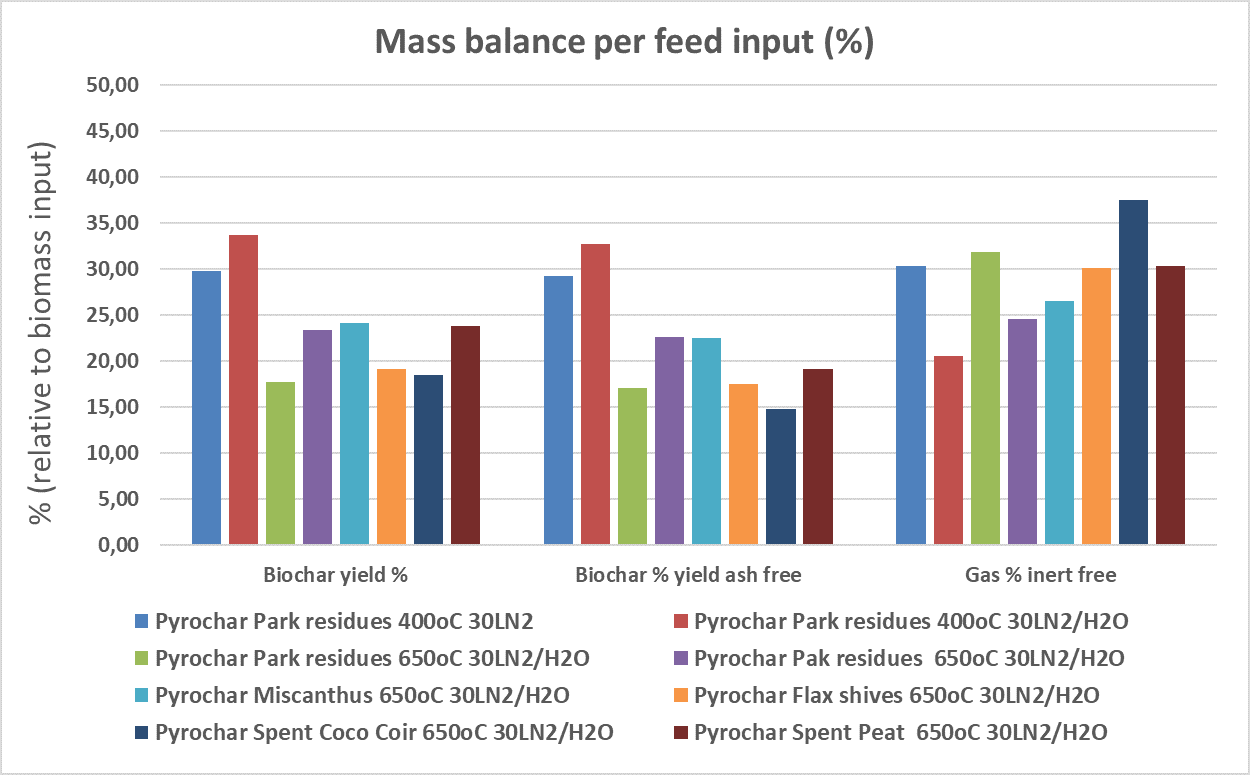
Figure 1. Biochar and co- product gas yield based on feed input Woody fraction of green waste = Park residues / Plant fibers = Miscanthus, Flax shives / Spent growing media = coco coir, spent peat
From Figure 1 one can observe that at 400°C the biochar yield is considerably higher than at 650°C. This has an impact on the properties of the biochars at those temperatures, with the lower T biochars being less stable than biochars at higher temperatures. However for the purpose of using them as peat substrates this difference may not be a decisive factor. The biochar properties are shown in Table 2 in the Annex.
Figure 2 focuses on a detailed energy balance, where some interesting observations are made. The difference between the red and blue line gives the heat in the produced gas which is available for further use, e.g. greenhouse heating. This availability fluctuates with the feedstock, the high ash fuels require a lot of heat that dissipates in the ash (inert) while high quality woody biomass requires heat for the pyrolysis but releases combustible gases that are valorised further downstream.
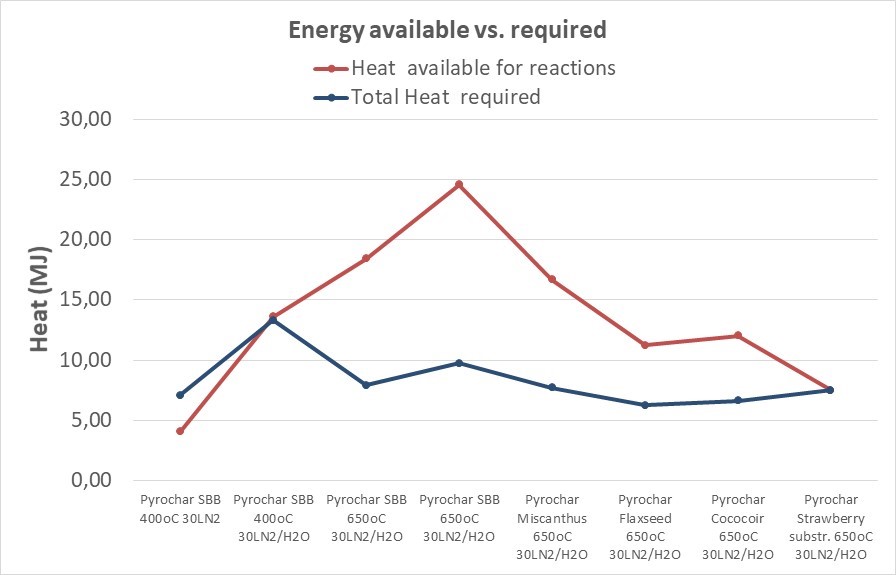
Figure 2. Required vs. available energy balance
The higher processing temperatures promote secondary reactions involving strong thermal cracking and reforming, resulting in an increase in permanent gas yield
The high N2 content in the product gas in some of the tests may pose a challenge for its potential use in a gas combustion system, as significant volumes of gas are needed to replace e.g. natural gas firing. Furthermore, because these gases are usually available at only a very low pump pressure, lean gases often cannot be utilized thermally. Instead they are flared off. Special burners exist though, that feature a low pressure requirement of only ~10 mbar. The energy balance shown in Figure 2, indicates that the energy content of the by-produced gas from the pyrolysis process is sufficient to cover the energy needs for the whole pyrolysis reactions, including the warming up and steam production, as well as the endothermic reactions that take place. Therefore we conclude that the energy valorization of the product gas is feasible and cover the thermal needs of the installation.
Results for the second set of experiments:
- Biochar and combustible gas: Mass yield shown in Figure 1
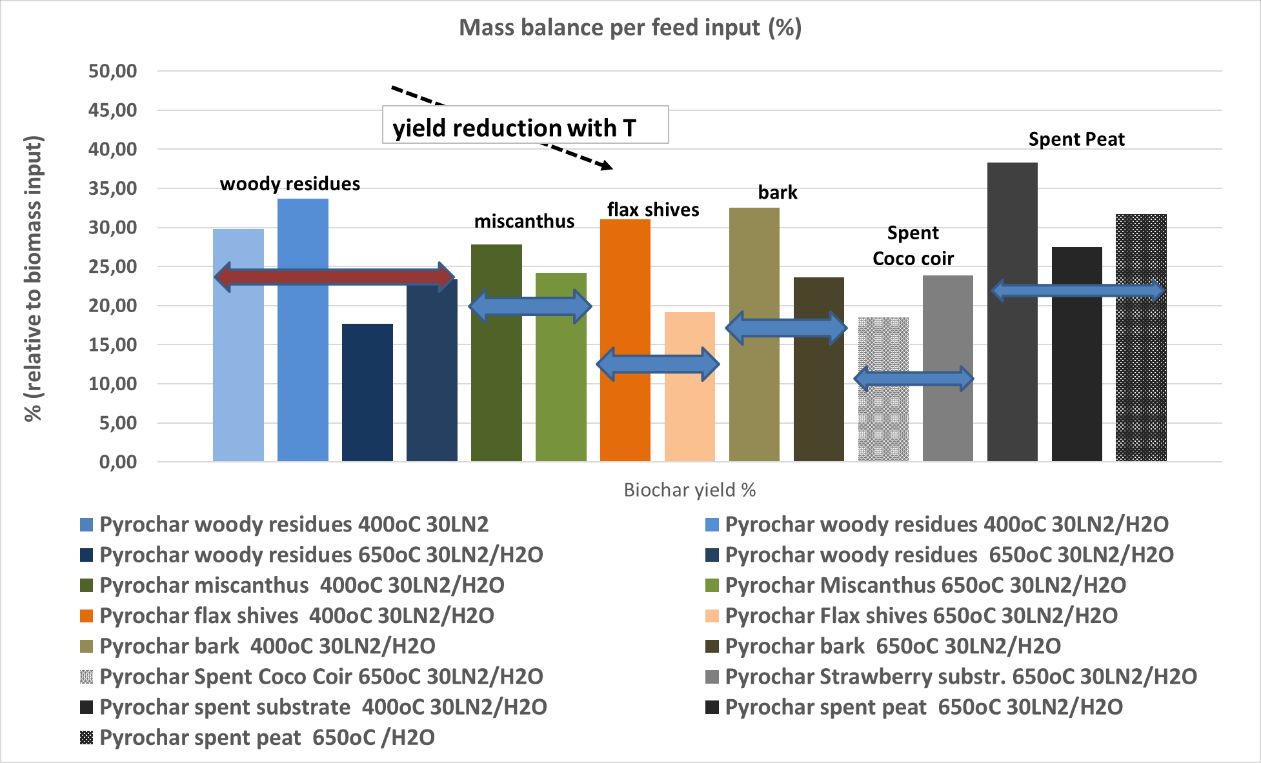
Figure 1. Biochar yield (mass %) for the second series of biochar production
Woody fraction of green waste = Park residues / Plant fibers = Miscanthus, Flax shives / Spent growing media = coco coir, spent peat
The high N2 content in the product gas in some of the tests may pose a challenge for its potential use in a gas combustion system, as significant volumes of gas are needed to replace e.g. natural gas firing. Furthermore, because these gases are usually available at only a very low pump pressure, lean gases often cannot be utilized thermally. Instead they are flared off. Special burners exist though, that feature a low pressure requirement of only ~10 mbar. The energy balance shown in Figure 2, indicates that the energy content of the by-produced gas from the pyrolysis process is sufficient to cover the energy needs for the whole pyrolysis reactions, including the warming up and steam production, as well as the endothermic reactions that take place. Therefore we conclude that the energy valorization of the product gas is feasible and cover the thermal needs of the installation.
Conclusions:
The high ash content feedstocks may be challenging in running a pyrolysis process self sustaining energetically, as the released combustible gas may be marginally sufficient for running the endothermal pyrolysis process and at the same time deliver surplus energy for heating.
The lower temperature pyrolysis leads to higher yields, as we can conclude by comparing with Figure 1.
Figure 2 summarizes the biochar yield per feedstock for the two temperatures, 400 and 650°C
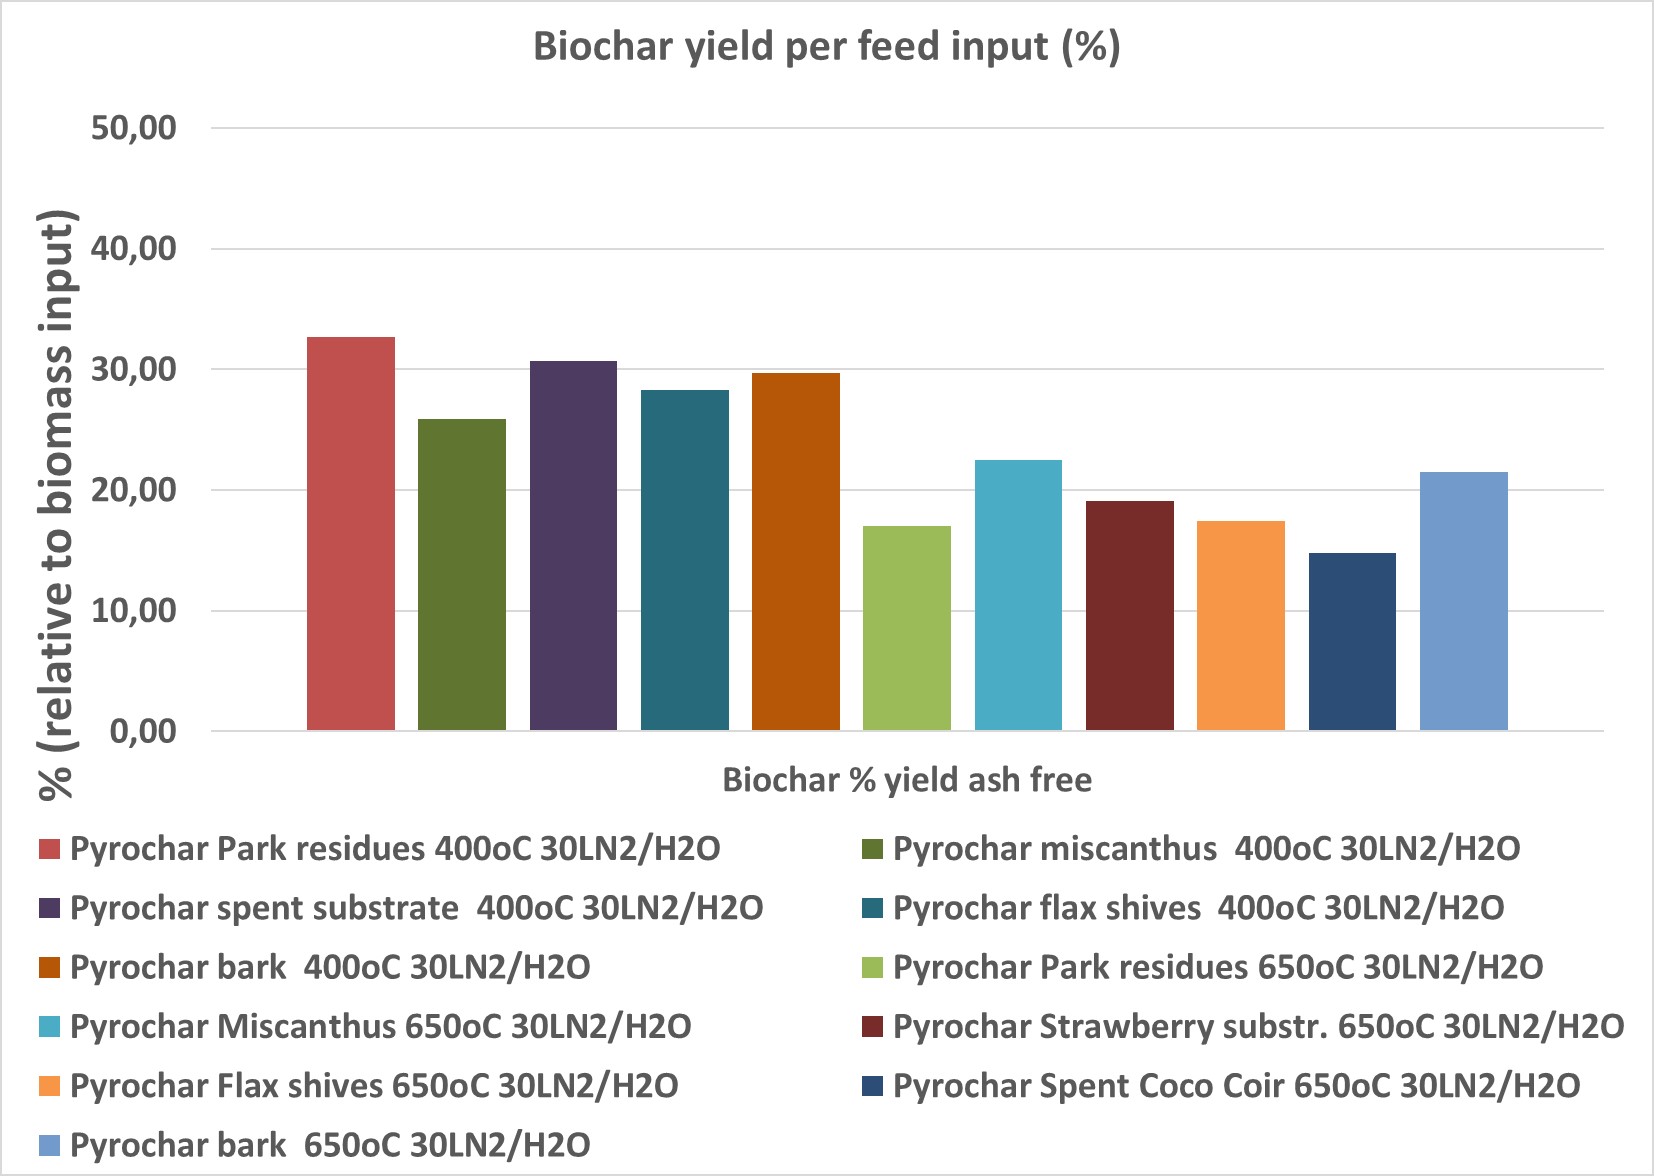
Figure 2. Biochar yield (%) in all the tests
Composting
Spent growing media can be composted by the grower, or at a certified composting facility. It is better to avoid too wet storage conditions.
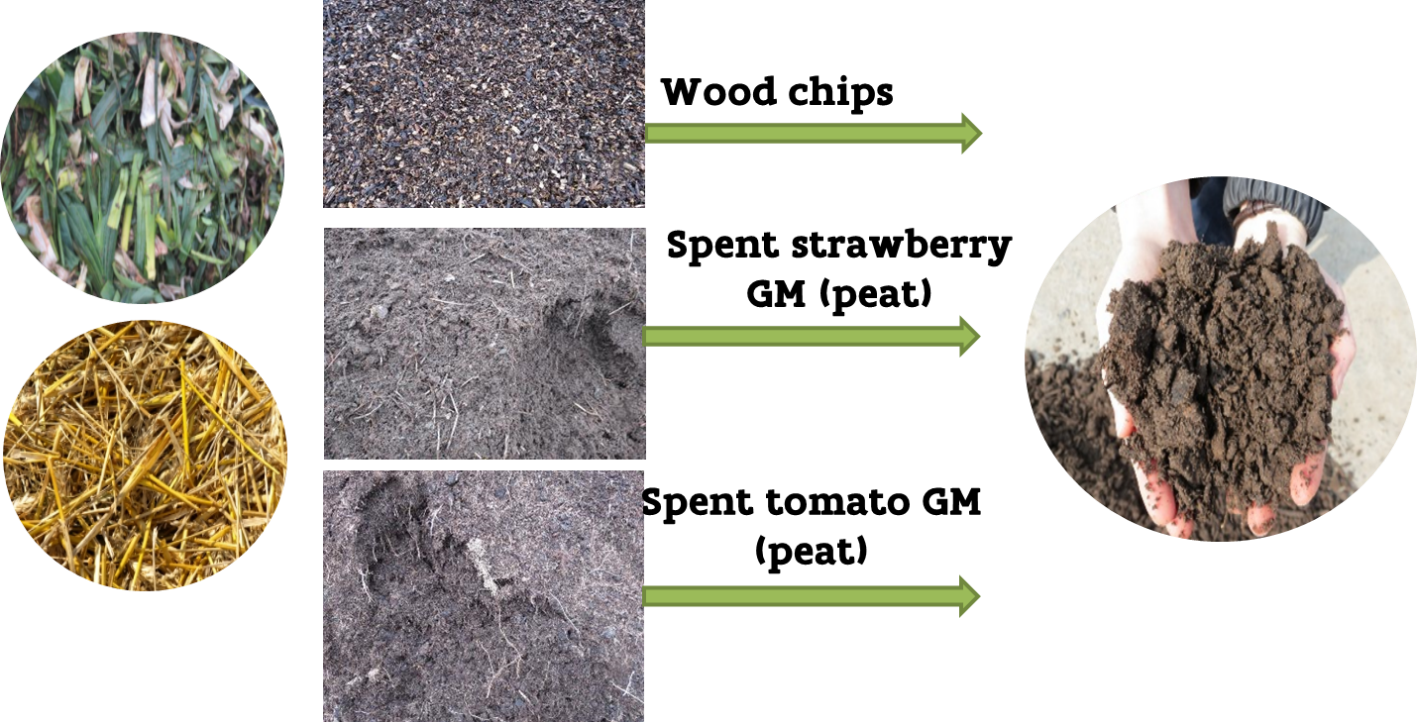
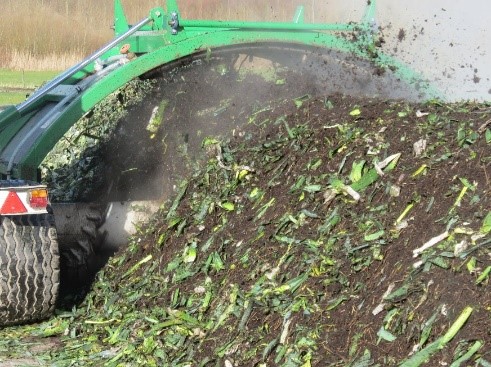
Spent growing media used in strawberry and tomato cultivation were used as bulking agent (BA) for processing leek residues in windrow composting. The compost trial was executed in open air on a concrete pad at the composting facility (compost pilot) of the experimental farm of the Institute for Agricultural and Fisheries Research (ILVO) in Merelbeke, Belgium. The compost piles were covered with a geotextile (TopTex® TenCate) to protect them from precipitation. During the composting process, temperature and CO2 levels were monitored at least twice per week. When the critical temperature and/or CO2 value (65°C and/or 16 vol% CO2) were reached, the piles were aerated by turning with the TG 301 Gujer Innotec compost turner and water was added when the mixture became too dry to avoid suboptimal process conditions.
The strawberry substrate consisted of 50% peat, 35% coconut fiber and 15% perlite, the tomato substrate consisted of 40% peat, 20% coconut fiber and 40% peat moss. Two windrows were set up; in the beginning of the process, each windrow was 12 m long, 3 m wide and 1.5 m high. Each windrow consisted of 200 kg of fresh straw and 4225 kg fresh weight (FW) of leek crop residues. Each windrow contained an equal volume (20.8 m³) of the BA, i.e., spent strawberry or tomato substrate. The strawberry substrate consisted of 50% peat, 35% coconut fiber and 15% perlite, the tomato substrate consisted of 40% peat, 20% coconut fiber and 40% peat moss.
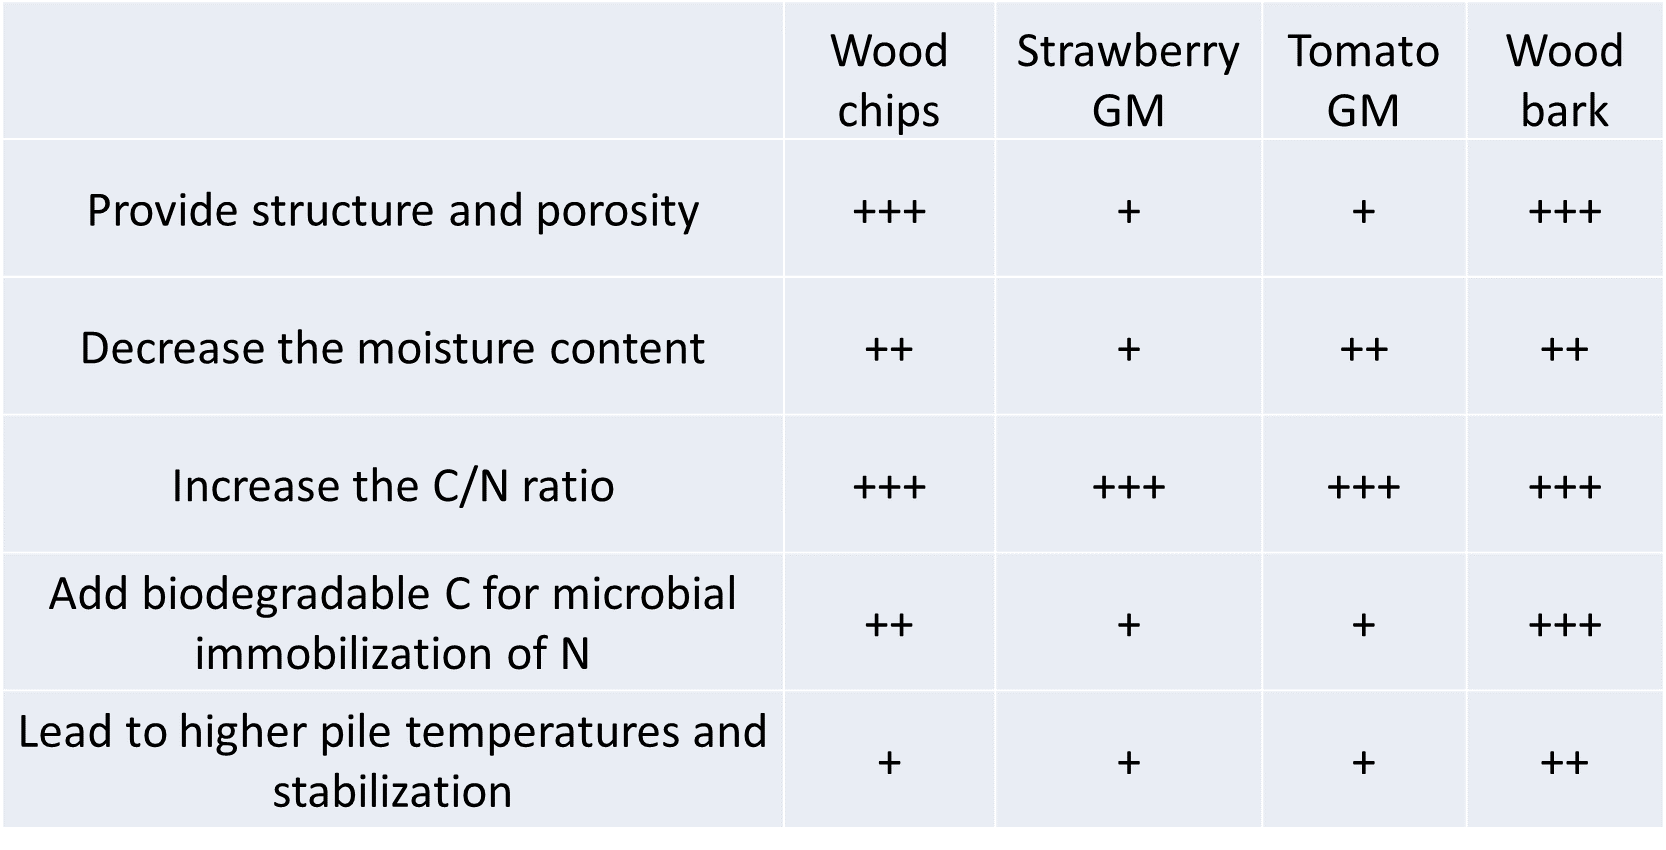
Compared to wood chips, spent strawberry and tomato substrates led to lower pile temperatures (max. 42°C) during the first nine days of composting. It is supposed that this was a pure physical effect due to the pores being blocked by the dense structure of the substrates. Aeration was lower, leading to anaerobic conditions after intense microbial activity, resulting in high CO2 concentrations, that subsequently hindered the further growth of aerobic microorganisms and thus the composting process. Turning the pile and adding a coarser BA (wood bark) reduced the density of the mixture, resulting in lower CO2 concentrations and thus increased oxygen availability. Additionally, the initial substrates and mixtures at the start were less biodegradable (lower OUR and biodegradation potential) compared to the wood chips mixtures (reference treatment). This is related to the recalcitrant C in the peat (the major component of the substrates). Only a small decrease in OM content and C/N ratio during the process were measured for the spent strawberry and tomato substrates used as BA.
When using spent growing substrates, the compost requires more frequent turning in comparison with wood chips due to oxygen shortage in these dense mixtures. To prevent oxygen shortage when applying these alternative BA, a coarser BA (i.e., larger particle size) with more structure could be added. Due to the suboptimal feedstock mixtures, pile temperatures did not surpass the required temperatures to ensure compost sanitation. Use of spent growing media resulted in lower OM degradation, because the substrates had a lower biodegradation potential related to the high content of recalcitrant C in the peat. Spent growing media in composting result in high CO2 concentrations. To be tested in the future together with other bulking agents.
Steam treatment
Steam treatment was not specifically tested in the Horti-BlueC project, but this treatment was successfully tested in the ReGrow4C project
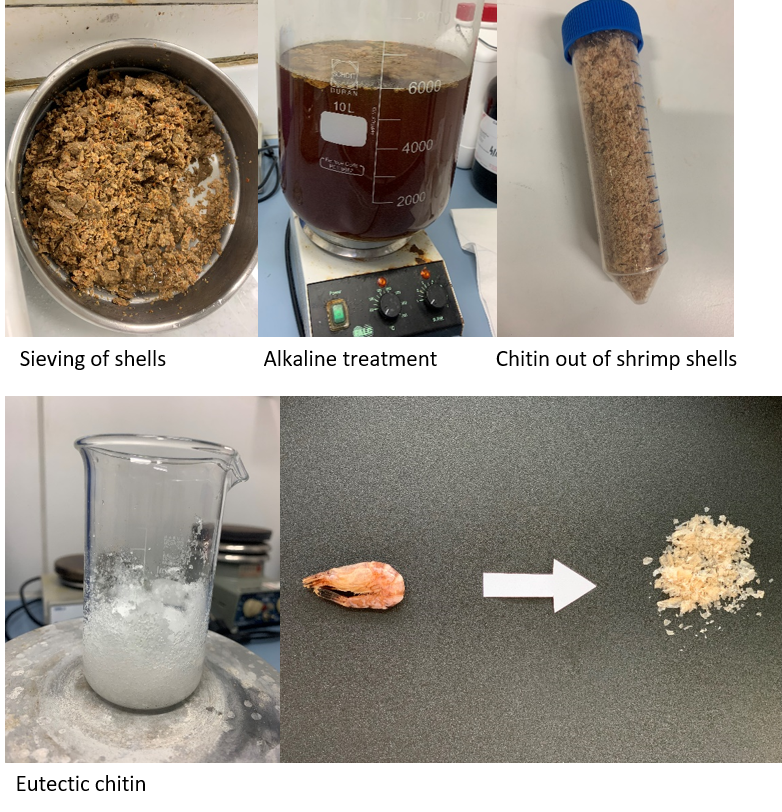
Chitin extraction
Chitin is a biopolymer that can be extracted from shellfish waste. The extraction can be chemically and enzymatically be performed (click on the boxes of these techniques for more information).
Torrefaction
Dry torrefaction, a mild temperature treatment at 250-320°C in the absence of oxygen, is an upgrading technology that increases the biomass energy density and grindability and thus enhances fuel quality and biologic stability while reduces the logistics costs related to transport and storage per energy unit.
An alternative pretreatment (next to chitin extraction) of the shrimp shells includes a dry roasting process. It is a relatively cheap alternative to the chemical chitin extraction process. The main aim is to preserve the chitin but to sanitize the material and make it more easy to store for longer periods of time.
The batch size fixed bed torrefaction reactor is shown in Picture 1. It is directly heated and typically handles 3-5 kg per feedstock/batch. The reactor consists of a vertical cylinder with and internal diameter (i.d.) of 16 cm and effective length of 1 m. The bed is divided in three sections to distinguish possible differences in torrefaction behaviour over the bed height. A gas distribution plate supports each section. The reactor is directly heated by supplying preheated nitrogen through a distributor plate at the bottom. In addition, trace heating is applied to compensate for the relatively large heat losses via the reactor vessel for this size of equipment. The off-gases are transported to an incinerator. The gas and tracing temperatures as well as the nitrogen flow are computer controlled and all temperatures, pressures and flows are logged
LEGAL ASPECTS
During the torrefaction, combustible gas is formed which is intended for heat production in gas boilers or combustors. Special care must be taken to avoid leaking of gas during the process. The standard safety equipment (gas monitoring, gas pipelines, fire security) with which the lab is equipped is sufficient to conform to safety rules.
Concerning the waste stream processing, the standard personal safety equipment (gloves, glasses) is sufficient, as the streams are not dangerous or toxic.
There are no legal aspects that may create obstacles as to the operation of the waste handling and the use of products.
PRETREATMENT
The waste streams need to be placed in an oven for drying prior to their storage, to avoid decay yeast formation before their thermal treatment. Shrimp waste contains 75% water. If the material is delivered fresh, it needs to be deep frozen to avoid odor formation. Long term storage is not possible.
The untreated materials must be dry and in air tight containers, the product (biochars) need to be stored in closed vessel to avoid dust inhalation.
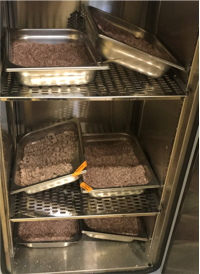
TESTS
Three batches of shrimp peels were roasted in the batch-reactor. First the shrimp peels were dried at 105°C overnight. Subsequently 20 liter of peels were loaded into the batch reactor. The reactor was heated to the desired temperature, being 200, 255 or 300°C. The heating up stage consisted of 1 hour. The temperature could be monitored by 3 thermocouples in the bottom, middle and top section. A continuous stream of nitrogen with 0.3% steam was applied during the whole period. The temperatures during roasting for the three tests are shown below.
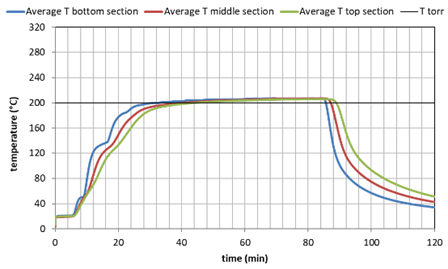
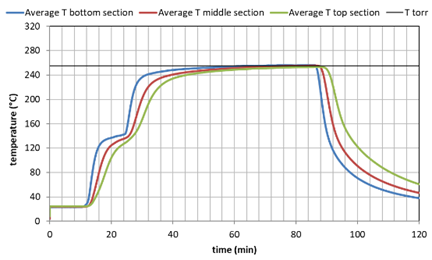
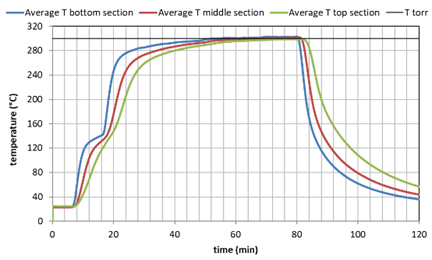
Figure 1. Temperature history during the 3 tests as average values of the lower, middle and higher reactor section.
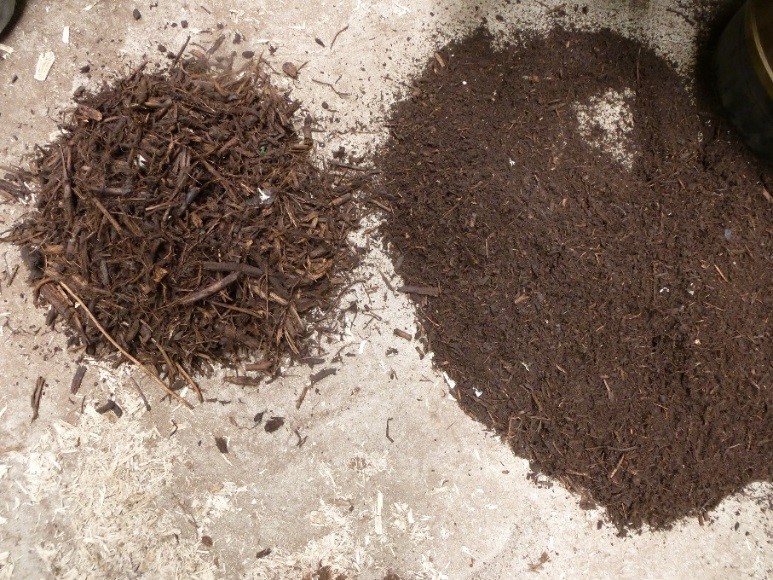
The different temperature treatment gave a very distinctly different color as shown in the picture 2 below. The mass loss of the material was: 6% at 200°C, 15% at 255°C and 26% at 300°C.
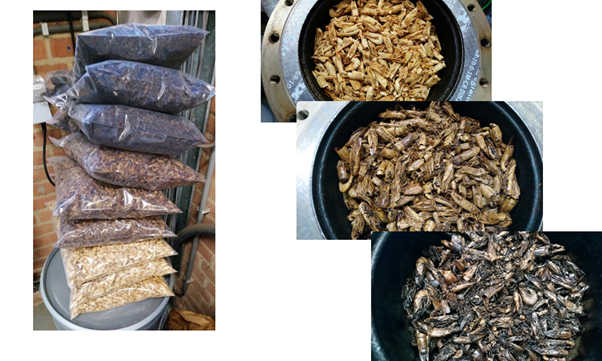
Picture 2. Torrefied materials
The torrefaction temperature majorly influences the quality of the final product in terms of composition and chitin content, an also influences the mass yield due to the increasing degree of volatile loss from 200°C to 300°C.
Purification
The Horti-BlueC project focuses on the use of a amine scrubbing system for carbon dioxide (CO2) capturing after a combustion process (Post Carbon Capture / PCC from ECN gasifier). Combined with the potential post cleaning of the captured CO2 to meet the requirements for example liquefaction (not taken into account in the Horti-BlueC project) or direct use in a greenhouse as CO2 fertilizer (main objective). Specific focus is on the pre-cleaning of the flue gases to make it suited for the amine scrubbing system. For this a CO2 capturing plant with below simplified Process flow diagram (PFD) is used.
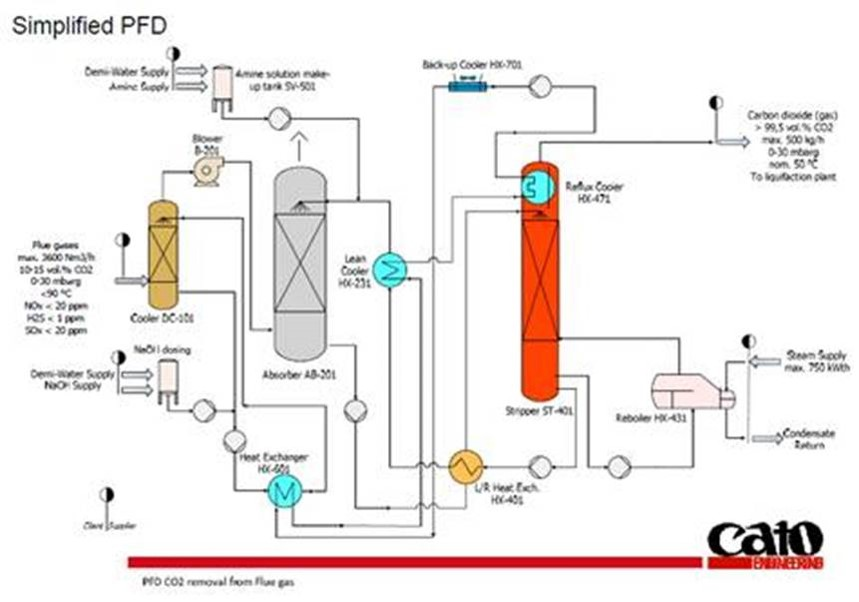
Further focus is on the pre treatment (e.g. NOx reduction technology) and make the flue gases more suited for capturing in a amine based plant.
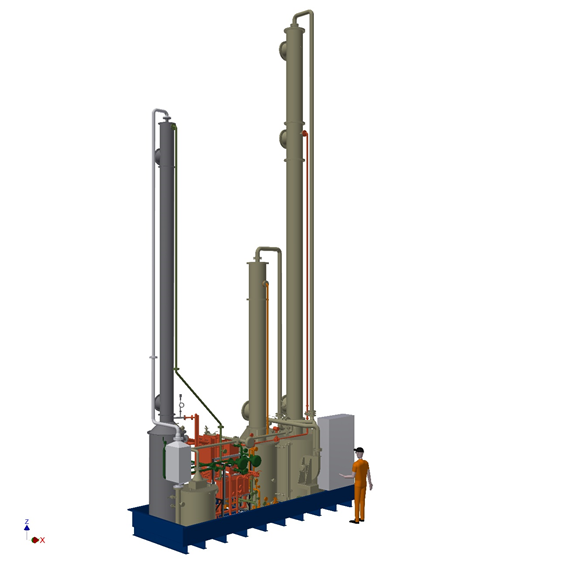
The pilot scale unit (amine capturing part in full scope of works) is represented in below 3D model.
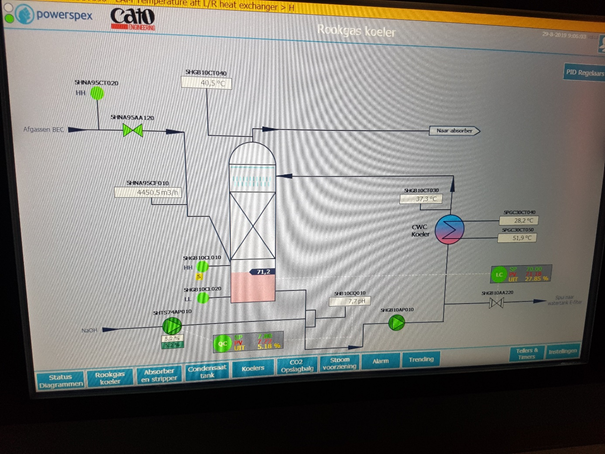
In front of this capturing plant several pre-treatment technologies can be mounted. The control of these pre-treatment is done from the same control panel a the CO2 capturing plant. Some of the testing can/will be done at a industrial scale plant in North-Holland. See picture of HMI screen of the relevant part of this plant below.
The water soluble pollutant can be scrubbed / removed from the flue gases within a direct contact cooler. By dosing NaOH the pH is controlled.
The flue gases from where the CO2 can be reclaimed are not able to be stored. The captured CO2 can be limited stored under ambient conditions. So the capturing plant must be operational when the flue gases are present. The reason that flue gases cannot (economically ) be stored is the relative low value of these gases. Only a small percentage of the flue gases are CO2 (typically 6-14 vol.%) which represent a value (the balance of nitrogen/oxygen does not represent a economical value).
Advantage of the technique: Current situation is the supply of liquid CO2 to growers. To produce this liquid CO2 much electricity is needed. The CO2 is liquified by compressing to high pressure and then cool the CO2 till very low temperature. The production of liquid CO2 and the places where it is used makes transport (by road and/or rail) needed, with further energy usage. The to be developed and tested technology must make it possible to have flue gases cleaned till such a extent that the flue gases can be dosed directly into a greenhouse. By doing so much less energy is needed and illuminating the need of transport.
Hammer mill
The axis with the hammers spins with a high speed, beating the material into fibers.
The fiber mill cannot process larger fractions than 15mm. If the selected material has larger fractions, please select the wood chipper as defiberization technique (return). The materials do not have to be dried, but they must be stored dry (e.g. under a roof), otherwise the machine would clog. If the selected material is not stored dry, please select another defiberization technique (return).
Materials (and their origin) tested in the fiber mill installation:
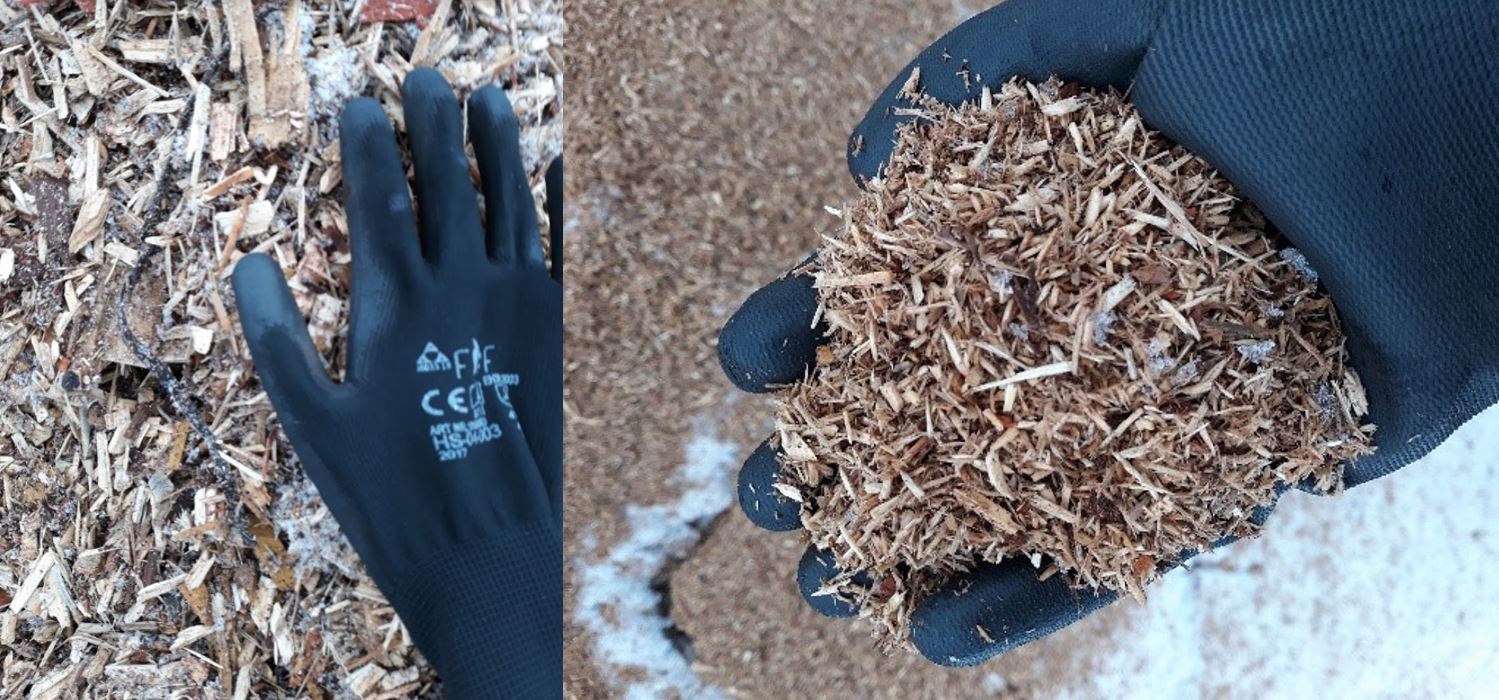
- Wood chips from wood industry (Poland) (Figure 1)
- Wood shavings from wood industry (Poland)
- Miscanthus (Poland)
- Bark of Pinus sylvestris (Poland) (Figure 2)
- Woody fraction sieved from peat bogs (Poland)
- Flax chives (Belgium) (Figure 3)
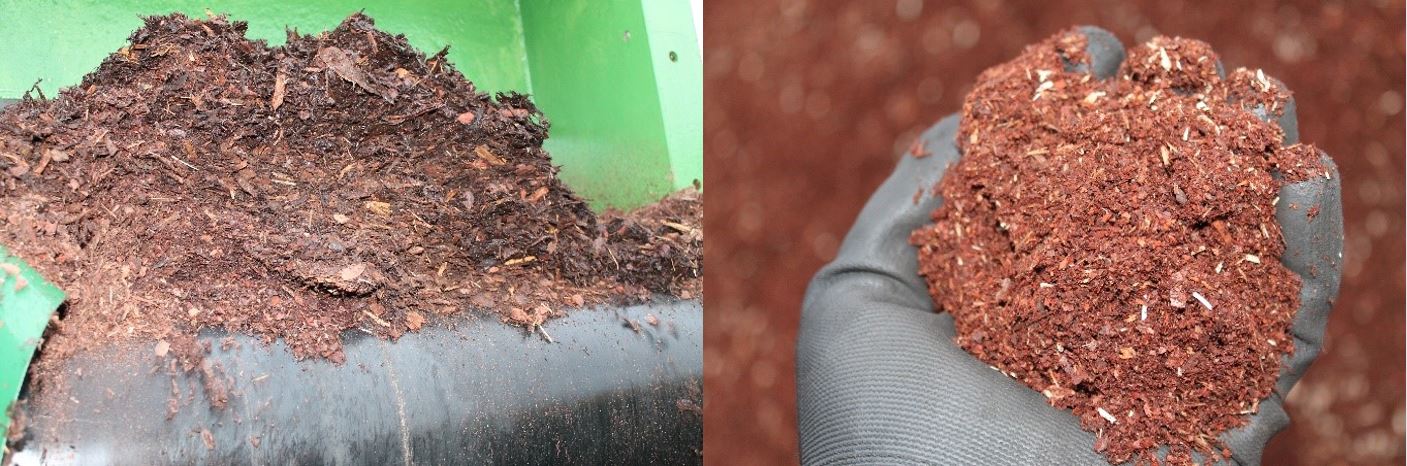
- Woody fraction of green waste compost (Belgium)
- Largest fraction of Pinus maritima bark (France) (Figure 4)
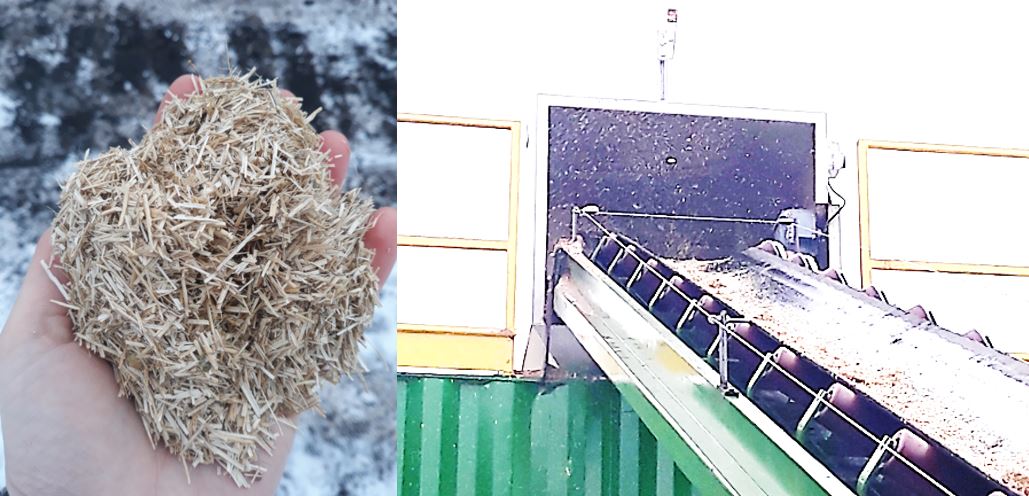
From the 8 materials listed above, only 2 materials were successfully defiberized in the fiber mill, namely the wood chips from the wood industry in Poland, and the bark of Pinus sylvestris from Poland. However, with both materials clogging of the hopper above the axis with the hammers occurred. This was most likely due to the fact that the materials were too wet, stuck together and formed bridges in the hopper, preventing the material to fall through. For this reason, a roof will be installed at the location in Poland to store the materials dry. Chives of Miscanthus and flax could not be milled. The under pressure inside the mill was too little and the small and dry chives were blown out of the machine (Figure 3).
The woody fraction of the peat bogs, the green waste compost and the Pinus maritima bark were too large to feed into the fiber mill. Furthermore, the bark contained large rocks and had to be sifted first. The green waste compost woody fraction contained lot of metal, this can be solved by placing a magnet above the input belt.
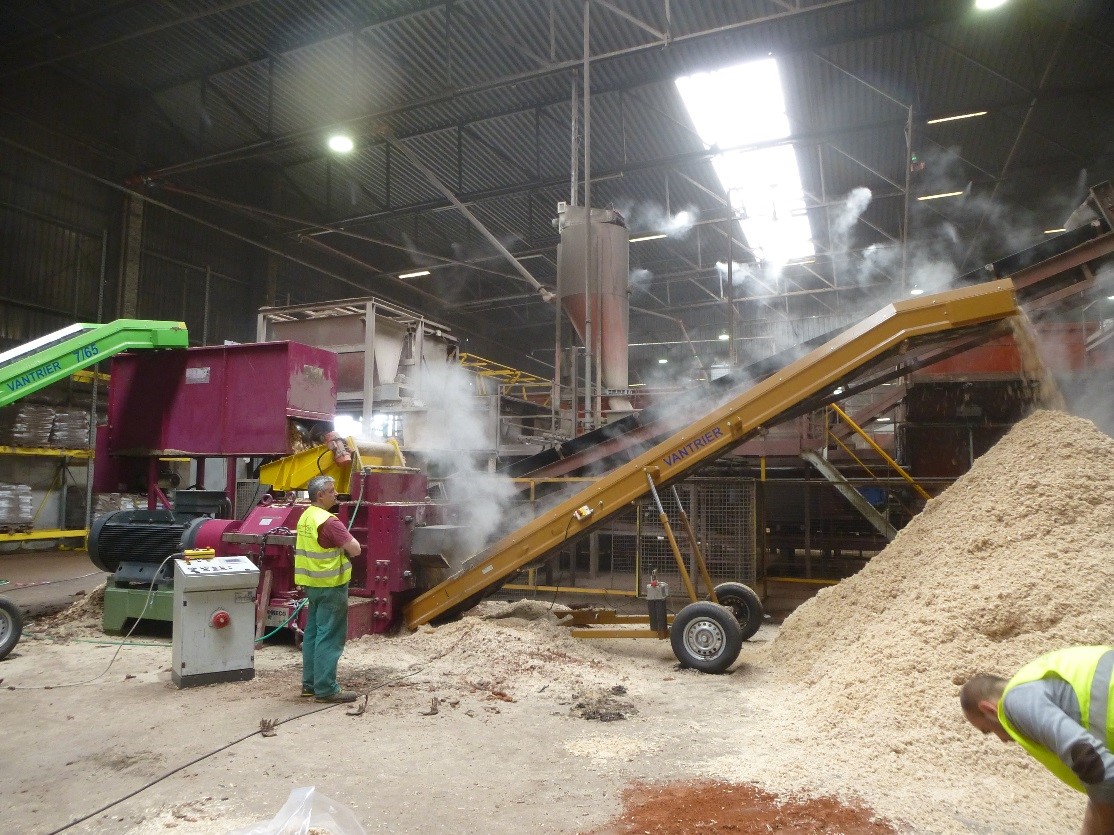
Extruder
Installation extruding wood and plant materials into fibers. The materials in the extrusion chamber are heated and pressurized, while 2 counter-rotating disks fracture the material. When the chamber is opened, the steam inside the material expands and causes the defiberization. Because of the use of high temperature, the material is sanitized during the process. No bacteria/fungi are present on the resulting plant fibers.
The extruder cannot process larger fractions than 15mm. If the selected material has larger fractions, you can first select the wood chipper as defiberization technique (see box below).
Different materials were tested, separate and mixed with each other:
- Wood chips (Figure 1)
- Woody fraction sieved (Poland)
- Woody fraction of green waste compost (Belgium)
- Miscanthus chives
Several parameters were varied during the trials to see what the effect is on the quality of the fibers. The parameters included the distance between the buffer plates, the input speed, the speed of the internal plates and the amount of water added.
It was possible to make fibers of each of the presented materials with the extruder. For each tested material, the fibers were collected for the different sets of parameters to conduct a physical analysis. This way the parameters can be optimized for each material. In the woody fraction of green waste a lot of metal waste was found. A magnet should be placed above the input belt to remove this waste.
Wood chipper
Chipping of wood, followed by screening on a drum screen. The wood chips on the screen are chipped again. It is possible that the fibers resulting from the wood chipper are too coarse for application in professional substrates. The materials should then be defiberized with another method (see other boxes).
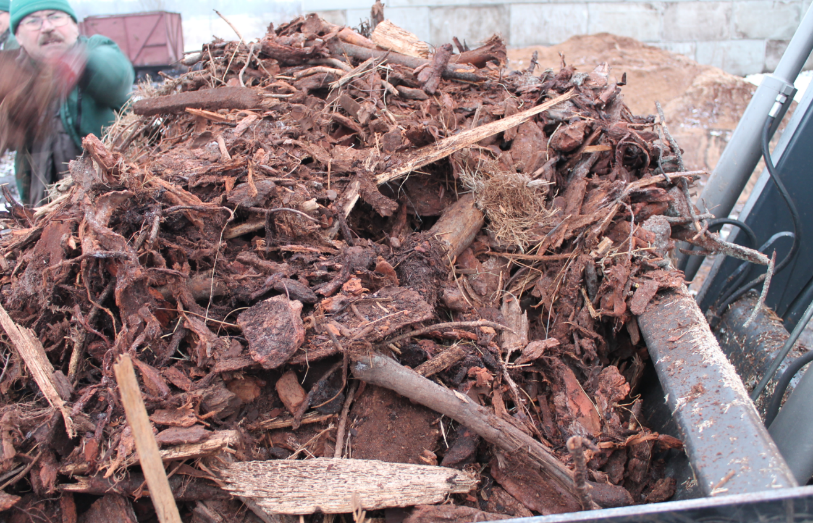
Tests: This chipper was used for the processing of fossilized wood, that was extracted from the Agaris peat bogs in either Lamzene or Bitenieku (Latvia). The chipped wood was post-screened on a 30x30 drumscreen.
- Lamzene bog wood chips milled with screen 30x30mm
- 50% Lamzene bog wood chips milled with screen 30x30 mm + 50% screenings
- Bitenieku bog wood chips milled with screen 30x30 mm
- birch logs were also chippered (Figure 7) with screen 30x30mm.
The pH from the fibers of the bog wood is quite low, on the same pH level as the peat surrounding it. This is the result of being enclosed in the peat for a very long time. The low pH makes this product ideal to lower the pH in peat free products, who usually have a pH around 6-7. The fibers resulting from the wood chipper were too coarse for application in professional substrates. The materials should be defiberized with another method.
Wood chipper
(tekst nog aan te leveren)
Enzymatic chitin extraction
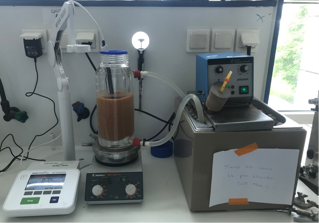
Lab tests
In shrimp shells, chitin is closely associated to proteins. Therefore, deproteinization in chitin extraction process is crucial. At Lille University, we have used a commercial enzyme to remove proteins. enzymatic hydrolysis was first designed at a lab scale before scaling-up at pilot plant scale. A commun process flow diagram is presented in Fig.1.
The commercial enzyme used is Alcalase. It is the most effective and employed enzyme among various commercial proteases to remove protein from crustacean shell.
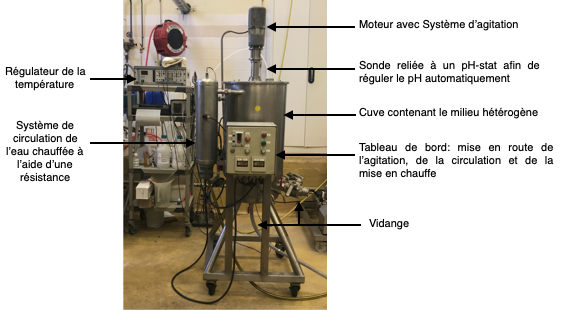
Deproteinization reactions were carried out in a 1 L jacketed glass reactor. Shrimp shells are first grinded and then mixed with distilled water. A solid/water ratio of 1/3 (w/v) is applied. The hydrolysis reaction is carried out by the addition of Alcalase under constant temperature (55°C) and pH (8.5) conditions. The pH value is maintained at 8.5 by the addition of 2.5 M NaOH. The reaction duration is fixed to 5h. Reaction is stopped by heating the mixture at 90°C during 20 minutes to inactivate the enzyme. Mixture is then filtered to separate solid phases. Deproteinized products in the solid phase are washed thoroughly until a neutral pH, and then dried overnight at 50°C.
Pilot scale tests
The mean composition of shells before and after enzymatic processing (pilot scale) is reported in the table below:
|
Composition (%) |
Shrimp shells |
Shrimp chitin |
|
Dry matter Ash Proteins
|
25,3 56 8,61 |
97,7 56 2,3 |
Deproteinization of shrimp shells using Alcalase leads to remove about 90% of proteins from the chitinous matrix of shrimp. The fact that deproteinization cannot reach 100% could be explained by the non-accessibility of enzymes to some proteins protected by chitin, since they are associated by covalent bonds.
The enzymatic processing of shrimp shells is relatively simple, less polluting, and less expensive, thus overcoming some of the shortcomings of chemical treatments.
Chemical chitin extraction
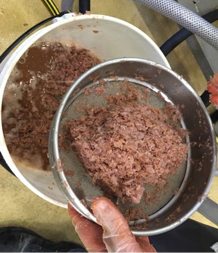
The amount of shrimp/crab peels available as waste stream is high. To find a better purpose for this waste stream than destruction, is the extraction of chitin an opportunity. Each species of shrimp/crab needs a different chemical method to extract chitin. The protocol to extract chitin from shrimp/crab peels, makes use of inorganic acids and alkaline solutions.
Lab test:
The shrimps are washed with tap and distilled water. The sample is weighed before drying (FW). The shells are dried at 65 °C for 6 hours, weighed (DW) and grinded (Hällde vertical cutter/blender VCB-61). The shrimp wastes are mixed in a fume hood with 1.5M HCl solution at a ratio of 1:10 (w/v) at 500 rpm for 3 hours to perform demineralization. The sample is washed with deionized water to neutrality in a 250 µm sieve and dried overnight at 60°C. The dry solid fractions are treated in a fume hood with 1M NaOH in 1:10 (w/v) ratio for 2 h at 500 rpm and 80°C to perform deproteinisation. The sample is washed with deionized water to neutrality in a 250 µm sieve and dried overnight at 60°C. The end weight (DW) of the chitin is determined.
The Chinese Mitten Crabs are washed with tap and distilled water. The sample is weighed before drying (FW). The shells are dried at 50 °C overnight, weighed (DW) and grinded (Hällde vertical cutter/blender VCB-61). The crab wastes are mixed in a fume hood with 6% HCl solution at a ratio of 25mL/g at 500 rpm for 2.5 hours to perform demineralization. The sample is washed with deionized water to neutrality in a 250 µm sieve and dried overnight at 65°C. The dry solid fractions are treated in a fume hood with 10% NaOH in 25mL/g ratio for 3 h at 500 rpm and 90°C to perform deproteinisation. The sample is washed with deionized water to neutrality in a 250 µm sieve and dried overnight at 65°C. The end weight (DW) of the chitin is determined.
Medium for plant rooting (peat/coir/mineral wool replacement)
Direct use in growing media possible. In the case of defiberization by an extruder, the material is also sterilized.
Biochar
Post-treatment is necessary, i.e. adding water to improve the water holding capacity. The resulting biochar has several potential applications, one of them is peat replacement. Greenhouse experiments are going on in the Horti-BlueC project to test the benefits from adding biochar in the growing media blend.
Chemical characteristics of the biochars produced for the Horti-BlueC project can be found in the tables below. They can vary widely depending on the feedstock material.
The produced biochars from the first series were also sent to EUROFINS in Germany for a set of characterizations specifically developed for biochar. None of the biochars contains too high trace elements or tars, but some biochars (the spent growing media) have very high amounts of salt and therefore a high pH. Therefore it is unlikely that they will be utilized unblended in the novel growing media.
The second batch was not analyzed in EUROFINS Germany, but in the own laboratory at ECN>TNO (see tables below). Tar content is very low for all biochar samples, both 400°C and 650°C .The 400°C samples have still a larger volatile content and C,H,O and N analyses show a higher carbon quantity for the 650 °C samples which is linked to recalcitrance and longer stability in soil. The 650 °C also have higher surface areas. Whereas the 400 °C samples have surface areas of typically < 5 m2/g, the 650 °C samples are typically in the 200-350 m2/g in case the material has an internal porosity structure (not the used growing media). The higher surface area and porosity are an important quality characteristic for all processes that require surface interaction. In general it can be stated that the yield of the 400°C samples is higher by roughly 10%, however, the quality and stability for carbon storage are much less than for the 650°C samples. It depends mainly on the application what is favored. In case the carbon storage after use and the surface area during peat replacement is important, the 650 °C is preferred despite its lower yield during production.
| Matrix | pH-H2O | EC | NO3-N | NH4-N | SO4 | Cl | P | C | Si |
| - | µS/cm | mg/l substrate | mg/l substrate | mg/l substrate | mg/l substrate | mg/l substrate | mg/l extract | mg/l extract | |
| charred flax shives | 9,78 | 392 | <5,0 | <5,0 | 45,1 | 50,8 | 4,8 | 482 | 0,9 |
| charred miscanthus | 9,05 | 191 | <5,0 | <5,0 | 16,5 | 17,1 | <4,7 | 322,3 | 2,1 |
| wood from forestry management SBB NL 400°C | 8,71 | 168 | <5,0 | <5,0 | 29,5 | 25,9 | <4,7 | 278,2 | 0,3 |
| wood from forestry management SBB NL 650°C | 9,2 | 170 | <5,0 | <5,0 | 16,5 | 26,5 | <4,7 | 421,9 | 0,2 |
| charred peat-based spent growing media from strawberry | 8,71 | 718 | <5,0 | <5,0 | 1219,6 | 136,2 | <4,7 | 133,1 | 0,7 |
| charred coir-based spent growing media from strawberry | 9,69 | 556 | <5,0 | <5,0 | 378 | 150,5 | <4,7 | 343,2 | 8,7 |
| Matrix | OM | Ntotal | Dry matter | C/N | fytotoxicity | IC |
| %/DM | %/DM | %/fresh | - | % | %/DM | |
| charred flax shives | 88,1 | 0,693 | 31,3 | 70,6 | 7,1 | <0,08 |
| charred miscanthus | 92,2 | 0,201 | 48,3 | 254,2 | 1 | <0,08 |
| wood from forestry management SBB NL 400°C | 94,7 | 0,574 | 48,7 | 91,6 | 0 | <0,08 |
| wood from forestry management SBB NL 650°C | 92,6 | 0,342 | 35,7 | 150,4 | 1 | <0,08 |
| charred peat-based spent growing media from strawberry | 73,2 | 1,189 | 33,7 | 34,2 | 0 | <0,08 |
| charred coir-based spent growing media from strawberry | 78,4 | 1,169 | 36 | 37,3 | 4,1 | <0,08 |
| Matrix | Al | Ca | Cd | Cr | Cu | Fe | K | Mg | Mn |
| mg/kg DM | mg/kg DM | mg/kg DM | mg/kg DM | mg/kg DM | mg/kg DM | mg/kg DM | mg/kg DM | mg/kg DM | |
| charred flax shives | 1802 | 16991 | 0,01 | 7,5 | 12 | 1537 | 13774 | 3345 | 105 |
| charred miscanthus | 64 | 4803 | 0,01 | 1,9 | 5 | 102 | 7887 | 1209 | 545 |
| wood from forestry management SBB NL 400°C | 54 | 10035 | 0,66 | 1,5 | 6 | 96 | 5859 | 1529 | 122 |
| wood from forestry management SBB NL 650°C | 570 | 14507 | 0,02 | 2,2 | 9 | 450 | 9317 | 2193 | 185 |
| charred peat-based spent growing media from strawberry | 3446 | 60441 | <0,01 | 7,9 | 86 | 5080 | 8324 | 9401 | 358 |
| charred coir-based spent growing media from strawberry | 1938 | 36816 | 0,02 | 11,7 | 62 | 4811 | 13142 | 1423 | 56 |
| Matrix | Na | Ni | P | Pb | Zn | Si |
| mg/kg DM | mg/kg DM | mg/kg DM | mg/kg DM | mg/kg DM | mg/kg DM | |
| charred flax shives | 856 | 11,1 | 3649 | 2,9 | 70 | 590 |
| charred miscanthus | 155 | 16,6 | 2078 | 2,3 | 60 | 642 |
| wood from forestry management SBB NL 400°C | 413 | 9,7 | 1164 | 2,7 | 100 | 120 |
| wood from forestry management SBB NL 650°C | 551 | 19,2 | 1750 | 3,5 | 146 | 182 |
| charred peat-based spent growing media from strawberry | 2061 | 16,8 | 2437 | 14,8 | 145 | 560 |
| charred coir-based spent growing media from strawberry | 2129 | 8,3 | 3543 | 3,2 | 114 | 574 |
| Matrix | NH4-N | P-AmAc | K-AmAc | Ca-AmAc | Mg-AmAc | Fe-AmAc | Mn-AmAc | Cu-AmAc | Zn-AmAc |
| mg/l substrate | mg/l substrate | mg/l substrate | mg/l substrate | mg/l substrate | mg/l substrate | mg/l substrate | mg/l substrate | mg/l substrate | |
| charred flax shives | <5,0 | 90,6 | 603,3 | 380 | <76,0 | <3,0 | 2,2 | <2,0 | 1,1 |
| charred miscanthus | <5,0 | <14,0 | 245,3 | <105,0 | <76,0 | <3,0 | 3,3 | <2,0 | <0,7 |
| wood from forestry management SBB NL 400°C | <5,0 | 19,4 | 220,4 | 195,5 | <76,0 | <3,0 | 1,6 | <2,0 | 0,9 |
| wood from forestry management SBB NL 650°C | <5,0 | <14,0 | 455 | 221,4 | <76,0 | <3,0 | <1,5 | <2,0 | 0,9 |
| charred peat-based spent growing media from strawberry | <5,0 | 56,9 | 666,7 | 1676,7 | 116,7 | 9,4 | 12,9 | <2,0 | 5,4 |
| charred coir-based spent growing media from strawberry | <5,0 | 68,4 | 660,1 | 500,4 | <76,0 | <3,0 | <1,5 | <2,0 | 3,2 |
Table: PAH content of the second series of biochars
| Analyse | Unit | Misc. 400 | Misc. 650 | Flax 400 | Spent peat 400 | Bark 400 | Bark 650 |
| Acenaphtene | µg/kg | <100 | <100 | <100 | <100 | <100 | <100 |
| Acenaphtylene | µg/kg | <10 | <10 | 13,84 | 21,73 | <10 | <10 |
| Anthracene | µg/kg | 29,27 | 16,74 | 24,85 | 46,17 | 24,81 | 13,69 |
| Benzo(a)anthracene | µg/kg | 17,3 | 12,74 | 14,83 | 46,61 | <10 | <10 |
| Benzo(a)pyrene | µg/kg | <10 | <10 | <10 | 42,87 | <10 | <10 |
| Benzo(b)fluoranthene | µg/kg | <10 | 10,3 | <10 | 25,98 | <10 | <10 |
| Benzo(ghi)perylene | µg/kg | <10 | <10 | <10 | 17,81 | <10 | <10 |
| Benzo(k)fluoranthene | µg/kg | <10 | <10 | <10 | <10 | <10 | <10 |
| Chrysene | µg/kg | 13,71 | 16,59 | <10 | 37,98 | <10 | <10 |
| Dibenz(ah)anthracene | µg/kg | <10 | <10 | <10 | <10 | <10 | <10 |
| Fluoranthene | µg/kg | 44,75 | 31,93 | 23,83 | 41,42 | 30,89 | 16,5 |
| Fluorene | µg/kg | 95,52 | 16,13 | 82,41 | 126,49 | 58,62 | 53,2 |
| Indeno(123-cd)pyrene | µg/kg | <10 | <10 | <10 | 15,78 | <10 | <10 |
| Naphthalene | µg/kg | 148,22 | 371,99 | 72,36 | 145,89 | 63,04 | 10,55 |
| Phenanthrene | µg/kg | 194,8 | 101,04 | 157,39 | 292,84 | 233,6 | 148,8 |
| Pyrene | µg/kg | 38,13 | 29,81 | 23,37 | 61,69 | 16,64 | <10 |
| total | 581,7 | 607,26 | 399,05 | 901,55 | 427,6 | 242,7 |
Table: Proximate, ultimate, inorganic (ICP) and surface area analysis of the second batch biochars
| Analysis | Unit | Misc. 400 | Misc. 650 | Flax 400 | Spent Peat 400 | Bark 400 | Bark 650 | Bark 650 |
| Cl | mg/kg | 35,5 | 87,1 | 78,27 | ||||
| Cl db | mg/kg | 88,43 | 361,44 | 71,41 | 728,76 | |||
| AsgeAshhalte (550) | % db | 4,73 | 10,21 | 5,51 | 21,88 | 2,01 | 3,32 | 2,97 |
| Ash (815) | % db | 4,58 | 9,91 | 4,86 | 19,77 | 1,55 | 2,54 | 2,42 |
| Volatiles | % db | 29,02 | 8,56 | 29,45 | 32,33 | 35,76 | 10,32 | 11,18 |
| W | % ar | 1,64 | 0,34 | <0.1 | <0.1 | <0.1 | <0.1 | <0.1 |
| HHV | MJ/kg | 26,51 | 31,2 | 32 | ||||
| HHV db | MJ/kg | 27,82 | 29,82 | 26,73 | 20,46 | |||
| O | % db | 16,57 | 4,95 | 18,1 | 21,07 | 21,23 | 5,31 | 6,24 |
| C | % | 72,34 | 80,79 | 70,78 | 56,26 | 70,91 | 87,26 | 85,41 |
| N | % | 0,24 | 0,22 | 0,73 | 1,26 | 0,26 | 0,24 | 0,16 |
| H | % | 3,78 | 1,76 | 3,72 | 3,36 | 3,49 | 2,03 | 2,18 |
| Al (db) | mg/kg | 59,08 | 163,92 | 1084,33 | 7190,32 | 552,47 | 883,11 | 891,9 |
| As | mg/kg | <3 | <3 | <3 | <3 | <3 | <3 | <3 |
| B | mg/kg | 3,88 | 5,36 | 30,47 | 14,84 | 13,53 | 26,24 | 20,94 |
| Ba | mg/kg | 23,37 | 49,53 | 15,66 | 73,15 | 5,61 | 8,59 | 6,92 |
| Ca | mg/kg | 2679,98 | 6424,88 | 10608,63 | 40651,95 | 5655,97 | 10338,45 | 8988,39 |
| Cd | mg/kg | 0,22 | 0,43 | 0,87 | <0.2 | 0,29 | <0.2 | <0.2 |
| Co | mg/kg | 2,4 | 9,9 | 3,97 | 6,12 | 1,81 | 13,97 | 15,44 |
| Cr | mg/kg | 17,69 | 311,82 | 7,58 | 7,98 | 5,82 | <2 | 2,2 |
| Cu | mg/kg | 4 | 19,57 | 7,27 | 52,34 | 3,4 | 5,48 | 4,99 |
| Fe | mg/kg | 272,12 | 16033,06 | 1105,39 | 4285,4 | 154,34 | 166,5 | 201,89 |
| K | mg/kg | 7985,16 | 8951,94 | 8340,12 | 7583,44 | 1718,16 | 3542,78 | 2651,31 |
| Li | mg/kg | <0.6 | <0.6 | 0,99 | 3,26 | <0.6 | <0.6 | <0.6 |
| Mg | mg/kg | 774,53 | 1372,65 | 2020,82 | 6706,45 | 820,68 | 1946,13 | 1390,17 |
| Mn | mg/kg | 569,28 | 767,44 | 67,04 | 235,31 | 51,41 | 127,59 | 77,69 |
| Mo | mg/kg | 2,84 | 43,07 | <1.7 | 33,99 | <1.7 | <1.7 | <1.7 |
| Na | mg/kg | 43,53 | 244,2 | 586,91 | 3561,32 | 266,03 | 492,45 | 387,37 |
| Ni | mg/kg | 20,93 | 239,06 | 6,28 | 8,28 | 6,7 | 15,17 | 13,24 |
| P | mg/kg | 1089,18 | 2855,41 | 2129,96 | 1596,53 | 223,81 | 508,82 | 359,48 |
| Pb | mg/kg | <1 | 12,46 | <1 | 11,22 | <1 | <1 | <1 |
| S | mg/kg | 757,2 | 577,2 | 415,19 | 5913,41 | 172,96 | 181,11 | 141,46 |
| Sb | mg/kg | <7 | 62,55 | <7 | <7 | <7 | <7 | <7 |
| Se | mg/kg | <3 | <3 | <3 | <3 | <3 | <3 | <3 |
| Si | mg/kg | 13058,08 | 24169,2 | 4970,23 | 36116,92 | 653,27 | 581,85 | 1306,81 |
| Sn | mg/kg | <2 | 3,71 | <2 | <2 | <2 | <2 | <2 |
| Sr | mg/kg | 5,67 | 16,73 | 32,65 | 109,67 | 11,4 | 19,63 | 16,88 |
| Ti | mg/kg | 2,87 | 15,16 | 31,42 | 237,06 | 3,58 | 3,47 | 5,83 |
| V | mg/kg | <0.5 | <0.5 | 2,12 | 7,47 | <0.5 | <0.5 | <0.5 |
| W | mg/kg | 16,39 | 90,64 | 96,33 | 127,95 | 6,48 | 184,82 | 307,04 |
| Zn | mg/kg | 50,09 | 104,66 | 36,07 | 88,57 | 30,04 | 51,87 | 32,58 |
| N2 adsorption (BET) | m2/g | <5 | 231 | <5 | <5 | <5 | 200 | 208 |
Heat
(tekst nog aan te leveren)
Compost
Direct use in growing media possible. An excess of nutrients in the growing media during cultivation may interfere with the reuse of growing media as BA for composting. Avoiding excess nutrient application during soilless cultivation could decrease nutrient contents of the spent growing media and would consequently result in a compost with a lower nutrient content and EC.
Medium for plant rooting (extended lifetime)
Steamed spent growing media can be reused. For more details, see the ReGrow4C project.
Chitin (enzymatically extracted)
Direct use in growing media possible if salt/nutrient contents of the spent growing media and the green materials are sufficiently low.
Chemical characteristics of the chitins prepared in the Horti-BlueC project are given in the table below.
| Source | pH-H2O | EC | NO3-N | NH4-N | SO4 | Na | Cl | |
| - | µS/cm | mg/l substrate | mg/l substrate | mg/l substrate | mg/l substrate | mg/l substrate | ||
| deproteinised crabshell from Ireland | reference | 10,4 | 1817 | <5,0 | <5,0 | 167 | 836,9 | 100,7 |
| Insect waste 1 | reference | 5,8 | 2700 | <5,0 | 93 | 134,9 | 187,6 | 542,9 |
| shrimp shells (cragon cragon) | feedstock | 9 | 4510 | 5,9 | 313,5 | 590,7 | 5238,7 | 4395 |
| charred shrimp shells 200°C (light colour) | ECN-TNO | 9,4 | 2580 | 10 | 25,4 | 361,4 | 2004,9 | 2434 |
| charred shrimp shells 255°C (light brown colour) | ECN-TNO | 9,4 | 2550 | 18,1 | 18,2 | 441,6 | 1697,6 | 2458 |
| charred shrimp shells 300°C (dark brown colour) | ECN-TNO | 10,2 | 2790 | 23,6 | 14,1 | 402,1 | 2451,7 | 2699 |
| cost-effectively extracted chitin from crab shells method1 | ILVO | 8,1 | 110 | <5,0 | <5,0 | 90,4 | <25,0 | 71 |
| cost-effectively extracted chitin from crab shells method2 | ILVO | 8,1 | 92 | <5,0 | <5,0 | 31,3 | <25,0 | 18 |
| cost-effectively extracted chitin from crab shells method3 | ILVO | 8,3 | 91 | <5,0 | <5,0 | 29,8 | 39,8 | 19 |
| cost-effectively extracted chitin from crab shells method4 | ILVO | 8,9 | 96 | <5,0 | <5,0 | 18,8 | 42,4 | 16 |
| Insect waste 1 | reference | 7,3 | 451 | <5,0 | 23,3 | 136,9 | 34,7 | 95 |
| chitin flakes from crab proccessed by Biolog | reference | 8,8 | 157 | <5.0 | <5.0 | 26 | 192,5 | 56,9 |
| Source | fytotoxicity | OM | ash | Ntotaal | C/N | DM | P in water | |
| % | %/DM | %/DM | %/DM | - | %/fresh | mg/l substrate | ||
| deproteinised crabshell from Ireland | reference | 13 | 23,2 | 76,8 | 1,7 | 7,5 | 96,3 | 14,5 |
| Insect waste 1 | reference | 100 | 92,1 | 7,9 | 10,6 | 4,8 | 95,4 | 1173,7 |
| shrimp shells (cragon cragon) | feedstock | 100 | 66,9 | 33,1 | 7,7 | 4,8 | 90,9 | 17,3 |
| charred shrimp shells 200°C (light colour) | ECN-TNO | 100 | 65,4 | 34,6 | 8,6 | 4,2 | 99,6 | 9,2 |
| charred shrimp shells 255°C (light brown colour) | ECN-TNO | 5 | 60,5 | 39,5 | 7,3 | 4,6 | 99,5 | 12,9 |
| charred shrimp shells 300°C (dark brown colour) | ECN-TNO | 5 | 53,4 | 46,6 | 6,9 | 4,3 | 99,9 | <4,7 |
| cost-effectively extracted chitin from crab shells method1 | ILVO | 90 | 92,7 | 7,3 | 7,6 | 6,8 | 95,5 | 7 |
| cost-effectively extracted chitin from crab shells method2 | ILVO | 100 | 96,2 | 3,8 | 7 | 7,6 | 94,5 | <4,7 |
| cost-effectively extracted chitin from crab shells method3 | ILVO | 7 | 92,2 | 7,8 | 7,1 | 7,2 | 94,4 | <4,7 |
| cost-effectively extracted chitin from crab shells method4 | ILVO | 13 | 93,6 | 6,4 | 7,6 | 6,8 | 93,9 | <4,7 |
| Insect waste 1 | reference | 100 | 82,8 | 17,2 | 8,7 | 5,3 | 96,2 | 118,8 |
| chitin flakes from crab proccessed by Biolog | reference | 13 | 99 | 1 | 7 | 91,6 |
| Source | C | Si | IC | OC | Al | Ca | Cd | |
| mg/l extract | mg/l extract | %/DM | %/DM | mg/kg DM | mg/kg DM | mg/kg DM | ||
| deproteinised crabshell from Ireland | reference | 1077 | 0,5 | 8,03 | 12,5 | 30 | 306845 | 0,03 |
| Insect waste 1 | reference | 5645 | 1,7 | 0,62 | 49,6 | 94 | 21811 | 0 |
| shrimp shells (cragon cragon) | feedstock | 3433 | 1 | 2,72 | 37,3 | 455 | 98144 | 0,09 |
| charred shrimp shells 200°C (light colour) | ECN-TNO | 1489 | 0,4 | 2,59 | 36,5 | 169 | 104889 | 0,02 |
| charred shrimp shells 255°C (light brown colour) | ECN-TNO | 1371 | 0,3 | 2,92 | 37,4 | 322 | 125274 | 0,07 |
| charred shrimp shells 300°C (dark brown colour) | ECN-TNO | 1012 | 0,3 | 3,17 | 35,8 | 144 | 141774 | 0,07 |
| cost-effectively extracted chitin from crab shells method1 | ILVO | 51 | 0,2 | <0,08 | 48,1 | 164 | 2862 | 0,02 |
| cost-effectively extracted chitin from crab shells method2 | ILVO | 76 | 0,2 | <0,08 | 47,7 | 151 | 4427 | 0,04 |
| cost-effectively extracted chitin from crab shells method3 | ILVO | 166 | 0,3 | <0,08 | 47,4 | 374 | 6742 | 0,02 |
| cost-effectively extracted chitin from crab shells method4 | ILVO | 188 | 0,4 | <0,08 | 48,6 | 316 | 9238 | 0,02 |
| Insect waste 1 | reference | 280 | 0,1 | 2,18 | 39,9 | 59 | 75231 | 0,19 |
| chitin flakes from crab proccessed by Biolog | reference | 86,1 |
| Source | Cr | Cu | Fe | K | Mg | Mn | Na | |
| mg/kg DM | mg/kg DM | mg/kg DM | mg/kg DM | mg/kg DM | mg/kg DM | mg/kg DM | ||
| deproteinised crabshell from Ireland | reference | 0,4 | 2 | 103 | 377 | 12917 | 11 | 12326 |
| Insect waste 1 | reference | 18,3 | 11 | 235 | 7510 | 1771 | 208 | 427 |
| shrimp shells (cragon cragon) | feedstock | 73,5 | 54 | 788 | 4353 | 3432 | 21 | 9398 |
| charred shrimp shells 200°C (light colour) | ECN-TNO | 0,4 | 49 | 158 | 3934 | 3487 | 11 | 9826 |
| charred shrimp shells 255°C (light brown colour) | ECN-TNO | 0,8 | 52 | 275 | 4097 | 3865 | 14 | 10127 |
| charred shrimp shells 300°C (dark brown colour) | ECN-TNO | 0,5 | 65 | 157 | 5074 | 4495 | 13 | 12563 |
| cost-effectively extracted chitin from crab shells method1 | ILVO | 2,9 | 3 | 474 | 125 | 193 | 2 | 39 |
| cost-effectively extracted chitin from crab shells method2 | ILVO | 1,7 | 3 | 166 | 120 | 246 | 1 | 158 |
| cost-effectively extracted chitin from crab shells method3 | ILVO | 2,8 | 5 | 260 | 172 | 427 | 2 | 554 |
| cost-effectively extracted chitin from crab shells method4 | ILVO | 1,5 | 4 | 280 | 161 | 476 | 2 | 483 |
| Insect waste 1 | reference | 0,4 | 13 | 191 | 11061 | 5829 | 1108 | 763 |
| Source | Ni | P | Pb | Zn | Si | P-AmAc | K-AmAc | |
| mg/kg DM | mg/kg DM | mg/kg DM | mg/kg DM | mg/kg DM | mg/l substrate | mg/l substrate | ||
| deproteinised crabshell from Ireland | reference | 0,2 | 8998 | 0,3 | 6 | 30 | 1119,2 | 180,2 |
| Insect waste 1 | reference | 2,9 | 5150 | 0,6 | 120 | 173 | 2196 | 3771 |
| shrimp shells (cragon cragon) | feedstock | 12,4 | 13133 | 1,1 | 86 | 567 | 3991,3 | 2171 |
| charred shrimp shells 200°C (light colour) | ECN-TNO | 1,1 | 13432 | 0,6 | 89 | 222 | 2572,9 | 684,9 |
| charred shrimp shells 255°C (light brown colour) | ECN-TNO | 1,2 | 15196 | 0,7 | 94 | 307 | 2099,7 | 598 |
| charred shrimp shells 300°C (dark brown colour) | ECN-TNO | 1 | 18153 | 0,9 | 120 | 209 | 2891,7 | 812,9 |
| cost-effectively extracted chitin from crab shells method1 | ILVO | 1,2 | 847 | 0,5 | 21 | 250 | 25,1 | <36,0 |
| cost-effectively extracted chitin from crab shells method2 | ILVO | 0,6 | 700 | 0,7 | 11 | 232 | 15,6 | <36,0 |
| cost-effectively extracted chitin from crab shells method3 | ILVO | 1,4 | 699 | 0,6 | 14 | 461 | <14,0 | <36,0 |
| cost-effectively extracted chitin from crab shells method4 | ILVO | 1,1 | 1526 | 0,6 | 16 | 389 | 64,8 | <36,0 |
| Insect waste 1 | reference | 0,2 | 7075 | 0,7 | 126 | 113 | 214,4 | 389,8 |
| Source | Ca-AmAc | Mg-AmAc | Fe-AmAc | Mn-AmAc | Cu-AmAc | Zn-AmAc | |
| mg/l substrate | mg/l substrate | mg/l substrate | mg/l substrate | mg/l substrate | mg/l substrate | ||
| deproteinised crabshell from Ireland | reference | 9280 | 1573,5 | <3,0 | <1,5 | <2,0 | <0,7 |
| Insect waste 1 | reference | 10135,5 | 780,3 | 9,5 | 90,9 | <2,0 | 33,3 |
| shrimp shells (cragon cragon) | feedstock | 49039,9 | 1682,7 | <3,0 | 4,7 | 5 | 9,8 |
| charred shrimp shells 200°C (light colour) | ECN-TNO | 22628,7 | 642,7 | <3,0 | 1,7 | <2,0 | 7,8 |
| charred shrimp shells 255°C (light brown colour) | ECN-TNO | 21426,6 | 563,5 | <3,0 | <1,5 | <2,0 | 3,8 |
| charred shrimp shells 300°C (dark brown colour) | ECN-TNO | 30213,7 | 761,2 | <3,0 | 1,8 | <2,0 | 2,4 |
| cost-effectively extracted chitin from crab shells method1 | ILVO | 249,7 | <76,0 | <3,0 | <1,5 | <2,0 | 1,3 |
| cost-effectively extracted chitin from crab shells method2 | ILVO | 224,3 | <76,0 | <3,0 | <1,5 | <2,0 | <0,7 |
| cost-effectively extracted chitin from crab shells method3 | ILVO | 404,9 | <76,0 | <3,0 | <1,5 | <2,0 | 0,7 |
| cost-effectively extracted chitin from crab shells method4 | ILVO | 686,9 | <76,0 | <3,0 | <1,5 | <2,0 | 1,1 |
| Insect waste 1 | reference | 2643,2 | 169,4 | <3,0 | 38,5 | <2,0 | 4,4 |
Chitin (chemically extracted)
Direct use in growing media is possible. The amount of shrimp peels/Chinese Mitten crabs available as waste stream is high. The cost price of chitin from shrimp/crab peels is lower than commercial chitin.
Chemical characteristics of the chitins prepared in the Horti-BlueC project are given in the table below.
| Source | pH-H2O | EC | NO3-N | NH4-N | SO4 | Na | Cl | |
| - | µS/cm | mg/l substrate | mg/l substrate | mg/l substrate | mg/l substrate | mg/l substrate | ||
| deproteinised crabshell from Ireland | reference | 10,4 | 1817 | <5,0 | <5,0 | 167 | 836,9 | 100,7 |
| Insect waste 1 | reference | 5,8 | 2700 | <5,0 | 93 | 134,9 | 187,6 | 542,9 |
| shrimp shells (cragon cragon) | feedstock | 9 | 4510 | 5,9 | 313,5 | 590,7 | 5238,7 | 4395 |
| charred shrimp shells 200°C (light colour) | ECN-TNO | 9,4 | 2580 | 10 | 25,4 | 361,4 | 2004,9 | 2434 |
| charred shrimp shells 255°C (light brown colour) | ECN-TNO | 9,4 | 2550 | 18,1 | 18,2 | 441,6 | 1697,6 | 2458 |
| charred shrimp shells 300°C (dark brown colour) | ECN-TNO | 10,2 | 2790 | 23,6 | 14,1 | 402,1 | 2451,7 | 2699 |
| cost-effectively extracted chitin from crab shells method1 | ILVO | 8,1 | 110 | <5,0 | <5,0 | 90,4 | <25,0 | 71 |
| cost-effectively extracted chitin from crab shells method2 | ILVO | 8,1 | 92 | <5,0 | <5,0 | 31,3 | <25,0 | 18 |
| cost-effectively extracted chitin from crab shells method3 | ILVO | 8,3 | 91 | <5,0 | <5,0 | 29,8 | 39,8 | 19 |
| cost-effectively extracted chitin from crab shells method4 | ILVO | 8,9 | 96 | <5,0 | <5,0 | 18,8 | 42,4 | 16 |
| Insect waste 1 | reference | 7,3 | 451 | <5,0 | 23,3 | 136,9 | 34,7 | 95 |
| chitin flakes from crab proccessed by Biolog | reference | 8,8 | 157 | <5.0 | <5.0 | 26 | 192,5 | 56,9 |
| Source | fytotoxicity | OM | ash | Ntotaal | C/N | DM | P in water | |
| % | %/DM | %/DM | %/DM | - | %/fresh | mg/l substrate | ||
| deproteinised crabshell from Ireland | reference | 13 | 23,2 | 76,8 | 1,7 | 7,5 | 96,3 | 14,5 |
| Insect waste 1 | reference | 100 | 92,1 | 7,9 | 10,6 | 4,8 | 95,4 | 1173,7 |
| shrimp shells (cragon cragon) | feedstock | 100 | 66,9 | 33,1 | 7,7 | 4,8 | 90,9 | 17,3 |
| charred shrimp shells 200°C (light colour) | ECN-TNO | 100 | 65,4 | 34,6 | 8,6 | 4,2 | 99,6 | 9,2 |
| charred shrimp shells 255°C (light brown colour) | ECN-TNO | 5 | 60,5 | 39,5 | 7,3 | 4,6 | 99,5 | 12,9 |
| charred shrimp shells 300°C (dark brown colour) | ECN-TNO | 5 | 53,4 | 46,6 | 6,9 | 4,3 | 99,9 | <4,7 |
| cost-effectively extracted chitin from crab shells method1 | ILVO | 90 | 92,7 | 7,3 | 7,6 | 6,8 | 95,5 | 7 |
| cost-effectively extracted chitin from crab shells method2 | ILVO | 100 | 96,2 | 3,8 | 7 | 7,6 | 94,5 | <4,7 |
| cost-effectively extracted chitin from crab shells method3 | ILVO | 7 | 92,2 | 7,8 | 7,1 | 7,2 | 94,4 | <4,7 |
| cost-effectively extracted chitin from crab shells method4 | ILVO | 13 | 93,6 | 6,4 | 7,6 | 6,8 | 93,9 | <4,7 |
| Insect waste 1 | reference | 100 | 82,8 | 17,2 | 8,7 | 5,3 | 96,2 | 118,8 |
| chitin flakes from crab proccessed by Biolog | reference | 13 | 99 | 1 | 7 | 91,6 |
| Source | C | Si | IC | OC | Al | Ca | Cd | |
| mg/l extract | mg/l extract | %/DM | %/DM | mg/kg DM | mg/kg DM | mg/kg DM | ||
| deproteinised crabshell from Ireland | reference | 1077 | 0,5 | 8,03 | 12,5 | 30 | 306845 | 0,03 |
| Insect waste 1 | reference | 5645 | 1,7 | 0,62 | 49,6 | 94 | 21811 | 0 |
| shrimp shells (cragon cragon) | feedstock | 3433 | 1 | 2,72 | 37,3 | 455 | 98144 | 0,09 |
| charred shrimp shells 200°C (light colour) | ECN-TNO | 1489 | 0,4 | 2,59 | 36,5 | 169 | 104889 | 0,02 |
| charred shrimp shells 255°C (light brown colour) | ECN-TNO | 1371 | 0,3 | 2,92 | 37,4 | 322 | 125274 | 0,07 |
| charred shrimp shells 300°C (dark brown colour) | ECN-TNO | 1012 | 0,3 | 3,17 | 35,8 | 144 | 141774 | 0,07 |
| cost-effectively extracted chitin from crab shells method1 | ILVO | 51 | 0,2 | <0,08 | 48,1 | 164 | 2862 | 0,02 |
| cost-effectively extracted chitin from crab shells method2 | ILVO | 76 | 0,2 | <0,08 | 47,7 | 151 | 4427 | 0,04 |
| cost-effectively extracted chitin from crab shells method3 | ILVO | 166 | 0,3 | <0,08 | 47,4 | 374 | 6742 | 0,02 |
| cost-effectively extracted chitin from crab shells method4 | ILVO | 188 | 0,4 | <0,08 | 48,6 | 316 | 9238 | 0,02 |
| Insect waste 1 | reference | 280 | 0,1 | 2,18 | 39,9 | 59 | 75231 | 0,19 |
| chitin flakes from crab proccessed by Biolog | reference | 86,1 |
| Source | Cr | Cu | Fe | K | Mg | Mn | Na | |
| mg/kg DM | mg/kg DM | mg/kg DM | mg/kg DM | mg/kg DM | mg/kg DM | mg/kg DM | ||
| deproteinised crabshell from Ireland | reference | 0,4 | 2 | 103 | 377 | 12917 | 11 | 12326 |
| Insect waste 1 | reference | 18,3 | 11 | 235 | 7510 | 1771 | 208 | 427 |
| shrimp shells (cragon cragon) | feedstock | 73,5 | 54 | 788 | 4353 | 3432 | 21 | 9398 |
| charred shrimp shells 200°C (light colour) | ECN-TNO | 0,4 | 49 | 158 | 3934 | 3487 | 11 | 9826 |
| charred shrimp shells 255°C (light brown colour) | ECN-TNO | 0,8 | 52 | 275 | 4097 | 3865 | 14 | 10127 |
| charred shrimp shells 300°C (dark brown colour) | ECN-TNO | 0,5 | 65 | 157 | 5074 | 4495 | 13 | 12563 |
| cost-effectively extracted chitin from crab shells method1 | ILVO | 2,9 | 3 | 474 | 125 | 193 | 2 | 39 |
| cost-effectively extracted chitin from crab shells method2 | ILVO | 1,7 | 3 | 166 | 120 | 246 | 1 | 158 |
| cost-effectively extracted chitin from crab shells method3 | ILVO | 2,8 | 5 | 260 | 172 | 427 | 2 | 554 |
| cost-effectively extracted chitin from crab shells method4 | ILVO | 1,5 | 4 | 280 | 161 | 476 | 2 | 483 |
| Insect waste 1 | reference | 0,4 | 13 | 191 | 11061 | 5829 | 1108 | 763 |
| Source | Ni | P | Pb | Zn | Si | P-AmAc | K-AmAc | |
| mg/kg DM | mg/kg DM | mg/kg DM | mg/kg DM | mg/kg DM | mg/l substrate | mg/l substrate | ||
| deproteinised crabshell from Ireland | reference | 0,2 | 8998 | 0,3 | 6 | 30 | 1119,2 | 180,2 |
| Insect waste 1 | reference | 2,9 | 5150 | 0,6 | 120 | 173 | 2196 | 3771 |
| shrimp shells (cragon cragon) | feedstock | 12,4 | 13133 | 1,1 | 86 | 567 | 3991,3 | 2171 |
| charred shrimp shells 200°C (light colour) | ECN-TNO | 1,1 | 13432 | 0,6 | 89 | 222 | 2572,9 | 684,9 |
| charred shrimp shells 255°C (light brown colour) | ECN-TNO | 1,2 | 15196 | 0,7 | 94 | 307 | 2099,7 | 598 |
| charred shrimp shells 300°C (dark brown colour) | ECN-TNO | 1 | 18153 | 0,9 | 120 | 209 | 2891,7 | 812,9 |
| cost-effectively extracted chitin from crab shells method1 | ILVO | 1,2 | 847 | 0,5 | 21 | 250 | 25,1 | <36,0 |
| cost-effectively extracted chitin from crab shells method2 | ILVO | 0,6 | 700 | 0,7 | 11 | 232 | 15,6 | <36,0 |
| cost-effectively extracted chitin from crab shells method3 | ILVO | 1,4 | 699 | 0,6 | 14 | 461 | <14,0 | <36,0 |
| cost-effectively extracted chitin from crab shells method4 | ILVO | 1,1 | 1526 | 0,6 | 16 | 389 | 64,8 | <36,0 |
| Insect waste 1 | reference | 0,2 | 7075 | 0,7 | 126 | 113 | 214,4 | 389,8 |
| Source | Ca-AmAc | Mg-AmAc | Fe-AmAc | Mn-AmAc | Cu-AmAc | Zn-AmAc | |
| mg/l substrate | mg/l substrate | mg/l substrate | mg/l substrate | mg/l substrate | mg/l substrate | ||
| deproteinised crabshell from Ireland | reference | 9280 | 1573,5 | <3,0 | <1,5 | <2,0 | <0,7 |
| Insect waste 1 | reference | 10135,5 | 780,3 | 9,5 | 90,9 | <2,0 | 33,3 |
| shrimp shells (cragon cragon) | feedstock | 49039,9 | 1682,7 | <3,0 | 4,7 | 5 | 9,8 |
| charred shrimp shells 200°C (light colour) | ECN-TNO | 22628,7 | 642,7 | <3,0 | 1,7 | <2,0 | 7,8 |
| charred shrimp shells 255°C (light brown colour) | ECN-TNO | 21426,6 | 563,5 | <3,0 | <1,5 | <2,0 | 3,8 |
| charred shrimp shells 300°C (dark brown colour) | ECN-TNO | 30213,7 | 761,2 | <3,0 | 1,8 | <2,0 | 2,4 |
| cost-effectively extracted chitin from crab shells method1 | ILVO | 249,7 | <76,0 | <3,0 | <1,5 | <2,0 | 1,3 |
| cost-effectively extracted chitin from crab shells method2 | ILVO | 224,3 | <76,0 | <3,0 | <1,5 | <2,0 | <0,7 |
| cost-effectively extracted chitin from crab shells method3 | ILVO | 404,9 | <76,0 | <3,0 | <1,5 | <2,0 | 0,7 |
| cost-effectively extracted chitin from crab shells method4 | ILVO | 686,9 | <76,0 | <3,0 | <1,5 | <2,0 | 1,1 |
| Insect waste 1 | reference | 2643,2 | 169,4 | <3,0 | 38,5 | <2,0 | 4,4 |
Charred material
Chemical characteristics of the charred shrimp shells prepared in the Horti-BlueC project are given in the table below.
| Source | pH-H2O | EC | NO3-N | NH4-N | SO4 | Na | Cl | |
| - | µS/cm | mg/l substrate | mg/l substrate | mg/l substrate | mg/l substrate | mg/l substrate | ||
| deproteinised crabshell from Ireland | reference | 10,4 | 1817 | <5,0 | <5,0 | 167 | 836,9 | 100,7 |
| Insect waste 1 | reference | 5,8 | 2700 | <5,0 | 93 | 134,9 | 187,6 | 542,9 |
| shrimp shells (cragon cragon) | feedstock | 9 | 4510 | 5,9 | 313,5 | 590,7 | 5238,7 | 4395 |
| charred shrimp shells 200°C (light colour) | ECN-TNO | 9,4 | 2580 | 10 | 25,4 | 361,4 | 2004,9 | 2434 |
| charred shrimp shells 255°C (light brown colour) | ECN-TNO | 9,4 | 2550 | 18,1 | 18,2 | 441,6 | 1697,6 | 2458 |
| charred shrimp shells 300°C (dark brown colour) | ECN-TNO | 10,2 | 2790 | 23,6 | 14,1 | 402,1 | 2451,7 | 2699 |
| cost-effectively extracted chitin from crab shells method1 | ILVO | 8,1 | 110 | <5,0 | <5,0 | 90,4 | <25,0 | 71 |
| cost-effectively extracted chitin from crab shells method2 | ILVO | 8,1 | 92 | <5,0 | <5,0 | 31,3 | <25,0 | 18 |
| cost-effectively extracted chitin from crab shells method3 | ILVO | 8,3 | 91 | <5,0 | <5,0 | 29,8 | 39,8 | 19 |
| cost-effectively extracted chitin from crab shells method4 | ILVO | 8,9 | 96 | <5,0 | <5,0 | 18,8 | 42,4 | 16 |
| Insect waste 1 | reference | 7,3 | 451 | <5,0 | 23,3 | 136,9 | 34,7 | 95 |
| chitin flakes from crab proccessed by Biolog | reference | 8,8 | 157 | <5.0 | <5.0 | 26 | 192,5 | 56,9 |
| Source | fytotoxicity | OM | ash | Ntotaal | C/N | DM | P in water | |
| % | %/DM | %/DM | %/DM | - | %/fresh | mg/l substrate | ||
| deproteinised crabshell from Ireland | reference | 13 | 23,2 | 76,8 | 1,7 | 7,5 | 96,3 | 14,5 |
| Insect waste 1 | reference | 100 | 92,1 | 7,9 | 10,6 | 4,8 | 95,4 | 1173,7 |
| shrimp shells (cragon cragon) | feedstock | 100 | 66,9 | 33,1 | 7,7 | 4,8 | 90,9 | 17,3 |
| charred shrimp shells 200°C (light colour) | ECN-TNO | 100 | 65,4 | 34,6 | 8,6 | 4,2 | 99,6 | 9,2 |
| charred shrimp shells 255°C (light brown colour) | ECN-TNO | 5 | 60,5 | 39,5 | 7,3 | 4,6 | 99,5 | 12,9 |
| charred shrimp shells 300°C (dark brown colour) | ECN-TNO | 5 | 53,4 | 46,6 | 6,9 | 4,3 | 99,9 | <4,7 |
| cost-effectively extracted chitin from crab shells method1 | ILVO | 90 | 92,7 | 7,3 | 7,6 | 6,8 | 95,5 | 7 |
| cost-effectively extracted chitin from crab shells method2 | ILVO | 100 | 96,2 | 3,8 | 7 | 7,6 | 94,5 | <4,7 |
| cost-effectively extracted chitin from crab shells method3 | ILVO | 7 | 92,2 | 7,8 | 7,1 | 7,2 | 94,4 | <4,7 |
| cost-effectively extracted chitin from crab shells method4 | ILVO | 13 | 93,6 | 6,4 | 7,6 | 6,8 | 93,9 | <4,7 |
| Insect waste 1 | reference | 100 | 82,8 | 17,2 | 8,7 | 5,3 | 96,2 | 118,8 |
| chitin flakes from crab proccessed by Biolog | reference | 13 | 99 | 1 | 7 | 91,6 |
| Source | C | Si | IC | OC | Al | Ca | Cd | |
| mg/l extract | mg/l extract | %/DM | %/DM | mg/kg DM | mg/kg DM | mg/kg DM | ||
| deproteinised crabshell from Ireland | reference | 1077 | 0,5 | 8,03 | 12,5 | 30 | 306845 | 0,03 |
| Insect waste 1 | reference | 5645 | 1,7 | 0,62 | 49,6 | 94 | 21811 | 0 |
| shrimp shells (cragon cragon) | feedstock | 3433 | 1 | 2,72 | 37,3 | 455 | 98144 | 0,09 |
| charred shrimp shells 200°C (light colour) | ECN-TNO | 1489 | 0,4 | 2,59 | 36,5 | 169 | 104889 | 0,02 |
| charred shrimp shells 255°C (light brown colour) | ECN-TNO | 1371 | 0,3 | 2,92 | 37,4 | 322 | 125274 | 0,07 |
| charred shrimp shells 300°C (dark brown colour) | ECN-TNO | 1012 | 0,3 | 3,17 | 35,8 | 144 | 141774 | 0,07 |
| cost-effectively extracted chitin from crab shells method1 | ILVO | 51 | 0,2 | <0,08 | 48,1 | 164 | 2862 | 0,02 |
| cost-effectively extracted chitin from crab shells method2 | ILVO | 76 | 0,2 | <0,08 | 47,7 | 151 | 4427 | 0,04 |
| cost-effectively extracted chitin from crab shells method3 | ILVO | 166 | 0,3 | <0,08 | 47,4 | 374 | 6742 | 0,02 |
| cost-effectively extracted chitin from crab shells method4 | ILVO | 188 | 0,4 | <0,08 | 48,6 | 316 | 9238 | 0,02 |
| Insect waste 1 | reference | 280 | 0,1 | 2,18 | 39,9 | 59 | 75231 | 0,19 |
| chitin flakes from crab proccessed by Biolog | reference | 86,1 |
| Source | Cr | Cu | Fe | K | Mg | Mn | Na | |
| mg/kg DM | mg/kg DM | mg/kg DM | mg/kg DM | mg/kg DM | mg/kg DM | mg/kg DM | ||
| deproteinised crabshell from Ireland | reference | 0,4 | 2 | 103 | 377 | 12917 | 11 | 12326 |
| Insect waste 1 | reference | 18,3 | 11 | 235 | 7510 | 1771 | 208 | 427 |
| shrimp shells (cragon cragon) | feedstock | 73,5 | 54 | 788 | 4353 | 3432 | 21 | 9398 |
| charred shrimp shells 200°C (light colour) | ECN-TNO | 0,4 | 49 | 158 | 3934 | 3487 | 11 | 9826 |
| charred shrimp shells 255°C (light brown colour) | ECN-TNO | 0,8 | 52 | 275 | 4097 | 3865 | 14 | 10127 |
| charred shrimp shells 300°C (dark brown colour) | ECN-TNO | 0,5 | 65 | 157 | 5074 | 4495 | 13 | 12563 |
| cost-effectively extracted chitin from crab shells method1 | ILVO | 2,9 | 3 | 474 | 125 | 193 | 2 | 39 |
| cost-effectively extracted chitin from crab shells method2 | ILVO | 1,7 | 3 | 166 | 120 | 246 | 1 | 158 |
| cost-effectively extracted chitin from crab shells method3 | ILVO | 2,8 | 5 | 260 | 172 | 427 | 2 | 554 |
| cost-effectively extracted chitin from crab shells method4 | ILVO | 1,5 | 4 | 280 | 161 | 476 | 2 | 483 |
| Insect waste 1 | reference | 0,4 | 13 | 191 | 11061 | 5829 | 1108 | 763 |
| Source | Ni | P | Pb | Zn | Si | P-AmAc | K-AmAc | |
| mg/kg DM | mg/kg DM | mg/kg DM | mg/kg DM | mg/kg DM | mg/l substrate | mg/l substrate | ||
| deproteinised crabshell from Ireland | reference | 0,2 | 8998 | 0,3 | 6 | 30 | 1119,2 | 180,2 |
| Insect waste 1 | reference | 2,9 | 5150 | 0,6 | 120 | 173 | 2196 | 3771 |
| shrimp shells (cragon cragon) | feedstock | 12,4 | 13133 | 1,1 | 86 | 567 | 3991,3 | 2171 |
| charred shrimp shells 200°C (light colour) | ECN-TNO | 1,1 | 13432 | 0,6 | 89 | 222 | 2572,9 | 684,9 |
| charred shrimp shells 255°C (light brown colour) | ECN-TNO | 1,2 | 15196 | 0,7 | 94 | 307 | 2099,7 | 598 |
| charred shrimp shells 300°C (dark brown colour) | ECN-TNO | 1 | 18153 | 0,9 | 120 | 209 | 2891,7 | 812,9 |
| cost-effectively extracted chitin from crab shells method1 | ILVO | 1,2 | 847 | 0,5 | 21 | 250 | 25,1 | <36,0 |
| cost-effectively extracted chitin from crab shells method2 | ILVO | 0,6 | 700 | 0,7 | 11 | 232 | 15,6 | <36,0 |
| cost-effectively extracted chitin from crab shells method3 | ILVO | 1,4 | 699 | 0,6 | 14 | 461 | <14,0 | <36,0 |
| cost-effectively extracted chitin from crab shells method4 | ILVO | 1,1 | 1526 | 0,6 | 16 | 389 | 64,8 | <36,0 |
| Insect waste 1 | reference | 0,2 | 7075 | 0,7 | 126 | 113 | 214,4 | 389,8 |
| Source | Ca-AmAc | Mg-AmAc | Fe-AmAc | Mn-AmAc | Cu-AmAc | Zn-AmAc | |
| mg/l substrate | mg/l substrate | mg/l substrate | mg/l substrate | mg/l substrate | mg/l substrate | ||
| deproteinised crabshell from Ireland | reference | 9280 | 1573,5 | <3,0 | <1,5 | <2,0 | <0,7 |
| Insect waste 1 | reference | 10135,5 | 780,3 | 9,5 | 90,9 | <2,0 | 33,3 |
| shrimp shells (cragon cragon) | feedstock | 49039,9 | 1682,7 | <3,0 | 4,7 | 5 | 9,8 |
| charred shrimp shells 200°C (light colour) | ECN-TNO | 22628,7 | 642,7 | <3,0 | 1,7 | <2,0 | 7,8 |
| charred shrimp shells 255°C (light brown colour) | ECN-TNO | 21426,6 | 563,5 | <3,0 | <1,5 | <2,0 | 3,8 |
| charred shrimp shells 300°C (dark brown colour) | ECN-TNO | 30213,7 | 761,2 | <3,0 | 1,8 | <2,0 | 2,4 |
| cost-effectively extracted chitin from crab shells method1 | ILVO | 249,7 | <76,0 | <3,0 | <1,5 | <2,0 | 1,3 |
| cost-effectively extracted chitin from crab shells method2 | ILVO | 224,3 | <76,0 | <3,0 | <1,5 | <2,0 | <0,7 |
| cost-effectively extracted chitin from crab shells method3 | ILVO | 404,9 | <76,0 | <3,0 | <1,5 | <2,0 | 0,7 |
| cost-effectively extracted chitin from crab shells method4 | ILVO | 686,9 | <76,0 | <3,0 | <1,5 | <2,0 | 1,1 |
| Insect waste 1 | reference | 2643,2 | 169,4 | <3,0 | 38,5 | <2,0 | 4,4 |
CO2 (fertilizer)
The technology makes it possible to provide CO2 that meets the requirements of greenhouse operators (the CO2 is conform OCAP specifications). Direct use in growing media possible: the CO2 capture is after the proposed technology sufficient clean to be directly dosed into a greenhouse.
From actual measurements executed by CATO it was seen that the pollutants are found in much smaller quantities in the captured CO2 then in the flue gas present. See below table:
| Carbon monoxide (CO) | nominal < 5 ppm |
| Ethene | nominal < 1 ppm |
| Benzene | nominal < 1 ppm |
| HF | nominal < 5 ppm |
| SO2 | nominal < 5 ppm |
| NOx | nominal < 5 ppm |
The actual values of the pollutant determine (partly) the actual amount of the pollutant in the flue gases.
Post-treatment is only necessary in case the capture rate and the use are not matched. In these cases liquefaction of the capture CO2 can be an option.